

Exchange balances have dropped to a multi-year low, yet the news is simultaneously reporting that nearly 50,000 BTC flowed into exchanges in a single day. Put those two headlines side by side, and doesn't something feel like it doesn't add up?This article won't dress up “balance at a new low” as some magic signal that the price is guaranteed to rise. Instead, it first walks you through exactly what exchange balance, single-day inflow, and whale activity each actually measure, and then tells you whether this data clash is really something you should treat as the sole basis for your entries and exits.
What Are Exchange Balance and Single-Day Inflow? What Do These Two Conflicting Data Points Actually Measure?
Have you ever wondered why, on the very same chain, two data points can show up that seem to contradict each other? Exchange balance and single-day inflow are actually two different rulers measuring the same thing — where Bitcoin ends up — one looking at long-term stock, the other at short-term flow.Once you understand what each of these two terms is actually counting, you'll be able to judge whether this “balance at a new low vs. massive single-day inflow” clash is a real contradiction or just two different conversations.
What Is Exchange Balance (Exchange Reserve), and Why Is It Often Treated as a Thermometer for Potential Sell Pressure?
Exchange balance refers to the total amount of Bitcoin held across the wallets of all major exchanges. On-chain analytics firms tag exchanges' public addresses and add them up, updating the figure daily. This number gets treated as a thermometer for a straightforward reason: coins sitting on an exchange can theoretically be sold at the push of a button — a world apart in liquidity from coins sitting in a hardware wallet or locked up in staking.When the balance keeps dropping, analysts often read it as meaning there's less supply available to dump immediately, which is exactly why every time exchange balance hits a new low, a wave of bullish chatter follows.
But this metric has an inherent limitation: it only tells you what type of address the coins are sitting in — it doesn't tell you what the owner intends to do.Someone withdrawing coins from an exchange might be doing so because they're bullish long-term and want to self-custody, or they might just be switching to a different exchange, or moving the coins to staking for yield — none of which is the same thing as “not selling.”So exchange balance can only serve as reference background — it shouldn't be used on its own to draw a buy or sell conclusion, and that's a point we'll keep coming back to when we look at both camps' arguments below.
What Does Single-Day Exchange Inflow Measure, and Why Does the Whale Version Get So Much Attention?
Exchange inflow measures the total amount of Bitcoin transferred, on a given day, from wallets outside exchanges into exchange addresses — it reflects how much supply gets moved somewhere it can be sold immediately, within a short window. This number has a baseline level every day; what actually makes the market nervous is when inflow suddenly spikes abnormally — especially when, once you break it down, it turns out to be a handful of large wallets moving funds in at once, rather than lots of retail investors each transferring small amounts. That's what earns it the “whale inflow” label.
The whale version is especially sensitive because a single move by a big holder can outweigh the combined total of thousands of retail accounts, so its potential impact on short-term price is naturally bigger, and historically a fair proportion of these moves have gone on to be followed by sell orders or large asks.But keep in mind, whale inflow is only a signal that someone has the ability to sell — it's not evidence that they've already sold, and getting this distinction right is what will determine how you read CryptoQuant's warning below.
The Full Picture of This Event (Balance at a Multi-Year Low vs. CryptoQuant's Warning of Nearly 50,000 BTC Flowing In Overnight)
Laid out on a timeline, this conflict is actually two separately published pieces of news stacked on top of each other.First, Coindesk and The Block cited on-chain data around July 9 showing that Bitcoin's exchange balance had fallen to its lowest level since 2017, down to only about 6.6% of circulating supply, while Ethereum's exchange balance hit its lowest level since 2015 — with both major coins moving in the same direction, it looked like a structural, long-term trend.
But rewind about ten days, and you'll find CryptoQuant had already issued a warning on June 30, pointing out that the amount of Bitcoin flowing into exchanges in a single day was approaching 50,000 — a scale described as an unusually extreme reading in recent times — while the average deposit size doubled at the same time, suggesting this inflow wasn't made up of retail activity but rather moves by a small number of large addresses.One report talks about balance hitting a new low, the other about a massive single-day inflow, and the timing is close together — no wonder it's read as contradictory. But in reality, these are phenomena playing out over different time spans, which we'll break apart and look at closely below.
How Does the Supply-Shock Camp Read This — Does a New Low in Balance Mean Bullish?
If all you saw was the headline fragment “exchange balance hits a new low,” wouldn't it be easy to instinctively think: less supply, it's about to moon?This camp's logic is actually backed by solid market fundamentals — reasoning from a shrinking supply side that price becomes easier to push up. Below, we lay out this camp's core logic, its supporting evidence, and the weak points it admits to itself, all at once, without rushing to a conclusion for you.
Core Logic: Less Sellable Supply Means Price Is Easier to Push
The supply-shock camp's starting point is simple: price is formed by matching buy and sell orders. If the supply sellers can immediately put up for sale keeps shrinking while buyer demand stays flat or even increases, then the same amount of buying pressure becomes easier to push price up with, because there's less sell-side supply to absorb.Exchange balance is treated as an instantly deliverable supply pool. When that pool runs low, the market's sensitivity to buy pressure rises, and a mid-sized buy order can cause more volatility than it would when the balance is abundant.
This logic has, in fact, shown up in past bull-market cycles — periods of long-term balance decline have often been accompanied by a slow, steady climb in price, which is why quite a few analysts treat it as one of the leading indicators of a medium-to-long-term trend.But correlation isn't causation — declining balance just makes it easier for upward resistance to shrink, it doesn't guarantee buying pressure actually shows up. That's also why this logic usually needs to be paired with other evidence, rather than used alone as an entry signal.
Supporting Evidence: Institutional Accumulation, Corporate Balance Sheets, and ETF Custody Growing in Tandem
What makes the supply-shock camp more persuasive is a handful of mutually reinforcing data points that showed up over the same period.Since spot ETFs started getting approved, the amount of Bitcoin they custody has kept climbing — these coins are mostly bought and then held for the long haul, without moving in and out of exchanges very often. At the same time, some publicly listed companies have added Bitcoin to their balance sheets as a long-term reserve; this kind of corporate-level buying tends to be held longer than retail buying, which also locks coins out of the circulating market.
Add up all this long-term buying, and to some extent it explains why the balance decline is structural — not a temporary fluctuation caused by a single event, but several separate flows of capital moving toward long-term holding at the same time.That said, the pace at which ETF custody and corporate reserves grow doesn't necessarily match the pace of balance decline, and forcing the two numbers together into one interpretation can sometimes overstate how strongly they're causally linked.
The Weak Point in This Argument: In the 2022 Bear Market, Balance Also Hit a Low, Yet Prices Kept Falling
The most common challenge to the supply-shock camp is that history isn't short on counterexamples where balance hit a new low and price just kept falling anyway.In the 2022 bear market, exchange balance also hit a low point at the time, and plenty of people called a bottom in supply and predicted a rebound. But what followed didn't play out according to that script — price kept grinding lower against a backdrop of macro tightening and one platform after another blowing up, and a low balance wasn't enough to offset the sell pressure created by the macro environment and a collapse in confidence.
This precedent points to a key limitation: exchange balance only reflects how many coins are sitting on exchanges — it doesn't reflect market sentiment, leverage levels, or whether systemic risk is brewing.When panic is strong enough, even with limited visible supply, off-exchange capital can still create sell pressure through derivatives or cross-platform transfers, and price can keep falling regardless. In other words, a new low in balance is, at best, one favorable backdrop for a rally — not a guarantee that one will happen.
How Does the Whale-Sell-Pressure / Redeployment Camp Read This — Is a Massive Single-Day Inflow a Bearish Warning Sign?
Flip the angle around: if you happened to notice this topic only after CryptoQuant published that warning, wouldn't tens of thousands of BTC flooding into exchanges in a single day sound alarming — like something big is about to happen?This camp's argument is likewise backed by solid logic, and it's deliberately structured to mirror the supply-shock camp above, so you can compare them side by side. Below, we break it into the same three pieces: core logic, key details, and recent cases.
Core Logic: A Large Transfer Into an Exchange Is Often a Prelude to Selling or Topping Up Margin
The whale-sell-pressure camp's argument rests on an intuitive assumption: ordinary people don't move large amounts of Bitcoin from a cold wallet into an exchange for no reason. This kind of large transfer usually corresponds to one of two possibilities — either preparing to sell for cash or stablecoins, or topping up margin on a position to avoid a leveraged position getting forcibly liquidated.Either way, from the market's perspective, this leans toward potential sell pressure — it's rarely just funds parked there for no reason.
This is also why on-chain analytics platforms like CryptoQuant have long treated net exchange inflow as one of the leading bearish-leaning signals — when inflow spikes abnormally, it's more readily read as someone preparing to make a move.Of course, this logic assumes the money is likely to actually be put to use once it's in. If those coins are just parked briefly and withdrawn again a few days later, the actual impact of what looked like a sell-pressure signal ends up being much smaller — which is also why you should hold back a little when reading a single day's number.
The Details Matter More: A Rising Average Deposit Size Is More Worth Watching Than the Total Inflow
Rather than just looking at how many coins flowed in in total today, it's more worthwhile to check whether the average deposit size grew along with it. If inflow increases but the size of individual deposits doesn't change much, it likely just means more retail or mid-size accounts are transferring coins — high dispersion, relatively limited destructive potential; but if total inflow rises at the same time the average deposit size also doubles, that suggests this wave of inflow is likely a concentrated move by a small number of large holders — high concentration, and if it turns into sell orders, the impact will be much more direct.
The reason CryptoQuant's warning this time drew so much discussion is precisely because the average deposit size doubled along with the total volume, not just the total volume alone — leading analysts to lean toward reading it as a specific large holder making a move.For readers, the next time you see similar news, rather than just staring at the headline total, spend a few extra seconds looking for whether there's data on the change in average deposit size — that's often the key detail for judging whether a signal is real.
Recent Reference Cases: Dormant Whales Waking Up, Rare Institutional Sales, and Other Concurrent Signals
What rounds out the whale-sell-pressure camp's picture is a handful of individual cases that showed up over the same period. From time to time, the market has seen old wallets that had been dormant for years suddenly wake up and move Bitcoin that hadn't budged in a long time over to an exchange in one go — these kinds of addresses are often thought to belong to early miners or holders, and once they become active again, it's easy to read that as a sign that even the most committed long-term holders are starting to let go; over the same period, some institutions or large holders have also made unusually large sell moves, unlike their typical pattern of accumulating.
On their own, each of these cases is just a scattered event, but layered on top of CryptoQuant's warning within the same time window, traders naturally string them together into a narrative where multiple signals all point toward sell pressure.That said, one reminder: dormant wallets waking up or institutions selling can happen for all kinds of reasons — a portfolio rebalance, tax planning, or a genuine shift to a bearish view. It's very hard for an outside observer to be 100% certain of the real motive, which is exactly why this kind of case should only be treated as a supplementary observation, not something that can carry the full weight of your judgment on its own.
Why Can Both Data Points Be True at the Same Time? How Should You Reconcile Them?
Having read through both camps' arguments, haven't you noticed that both sides make sense, yet neither seems to fully convince the other?When I look at this kind of conflicting data myself, the answer usually isn't to pick a side — it's to first understand that these two data points were never being compared on the same time scale or the same layer of capital to begin with. Once you pull them apart, you'll find that balance hitting a new low and a massive single-day inflow can be entirely true at the same time. Below, we reconcile this from three angles.
The Two Actually Measure Capital Movement at Different Levels: Long-Term Self-Custody Migration vs. Short-Term Trading Deposits
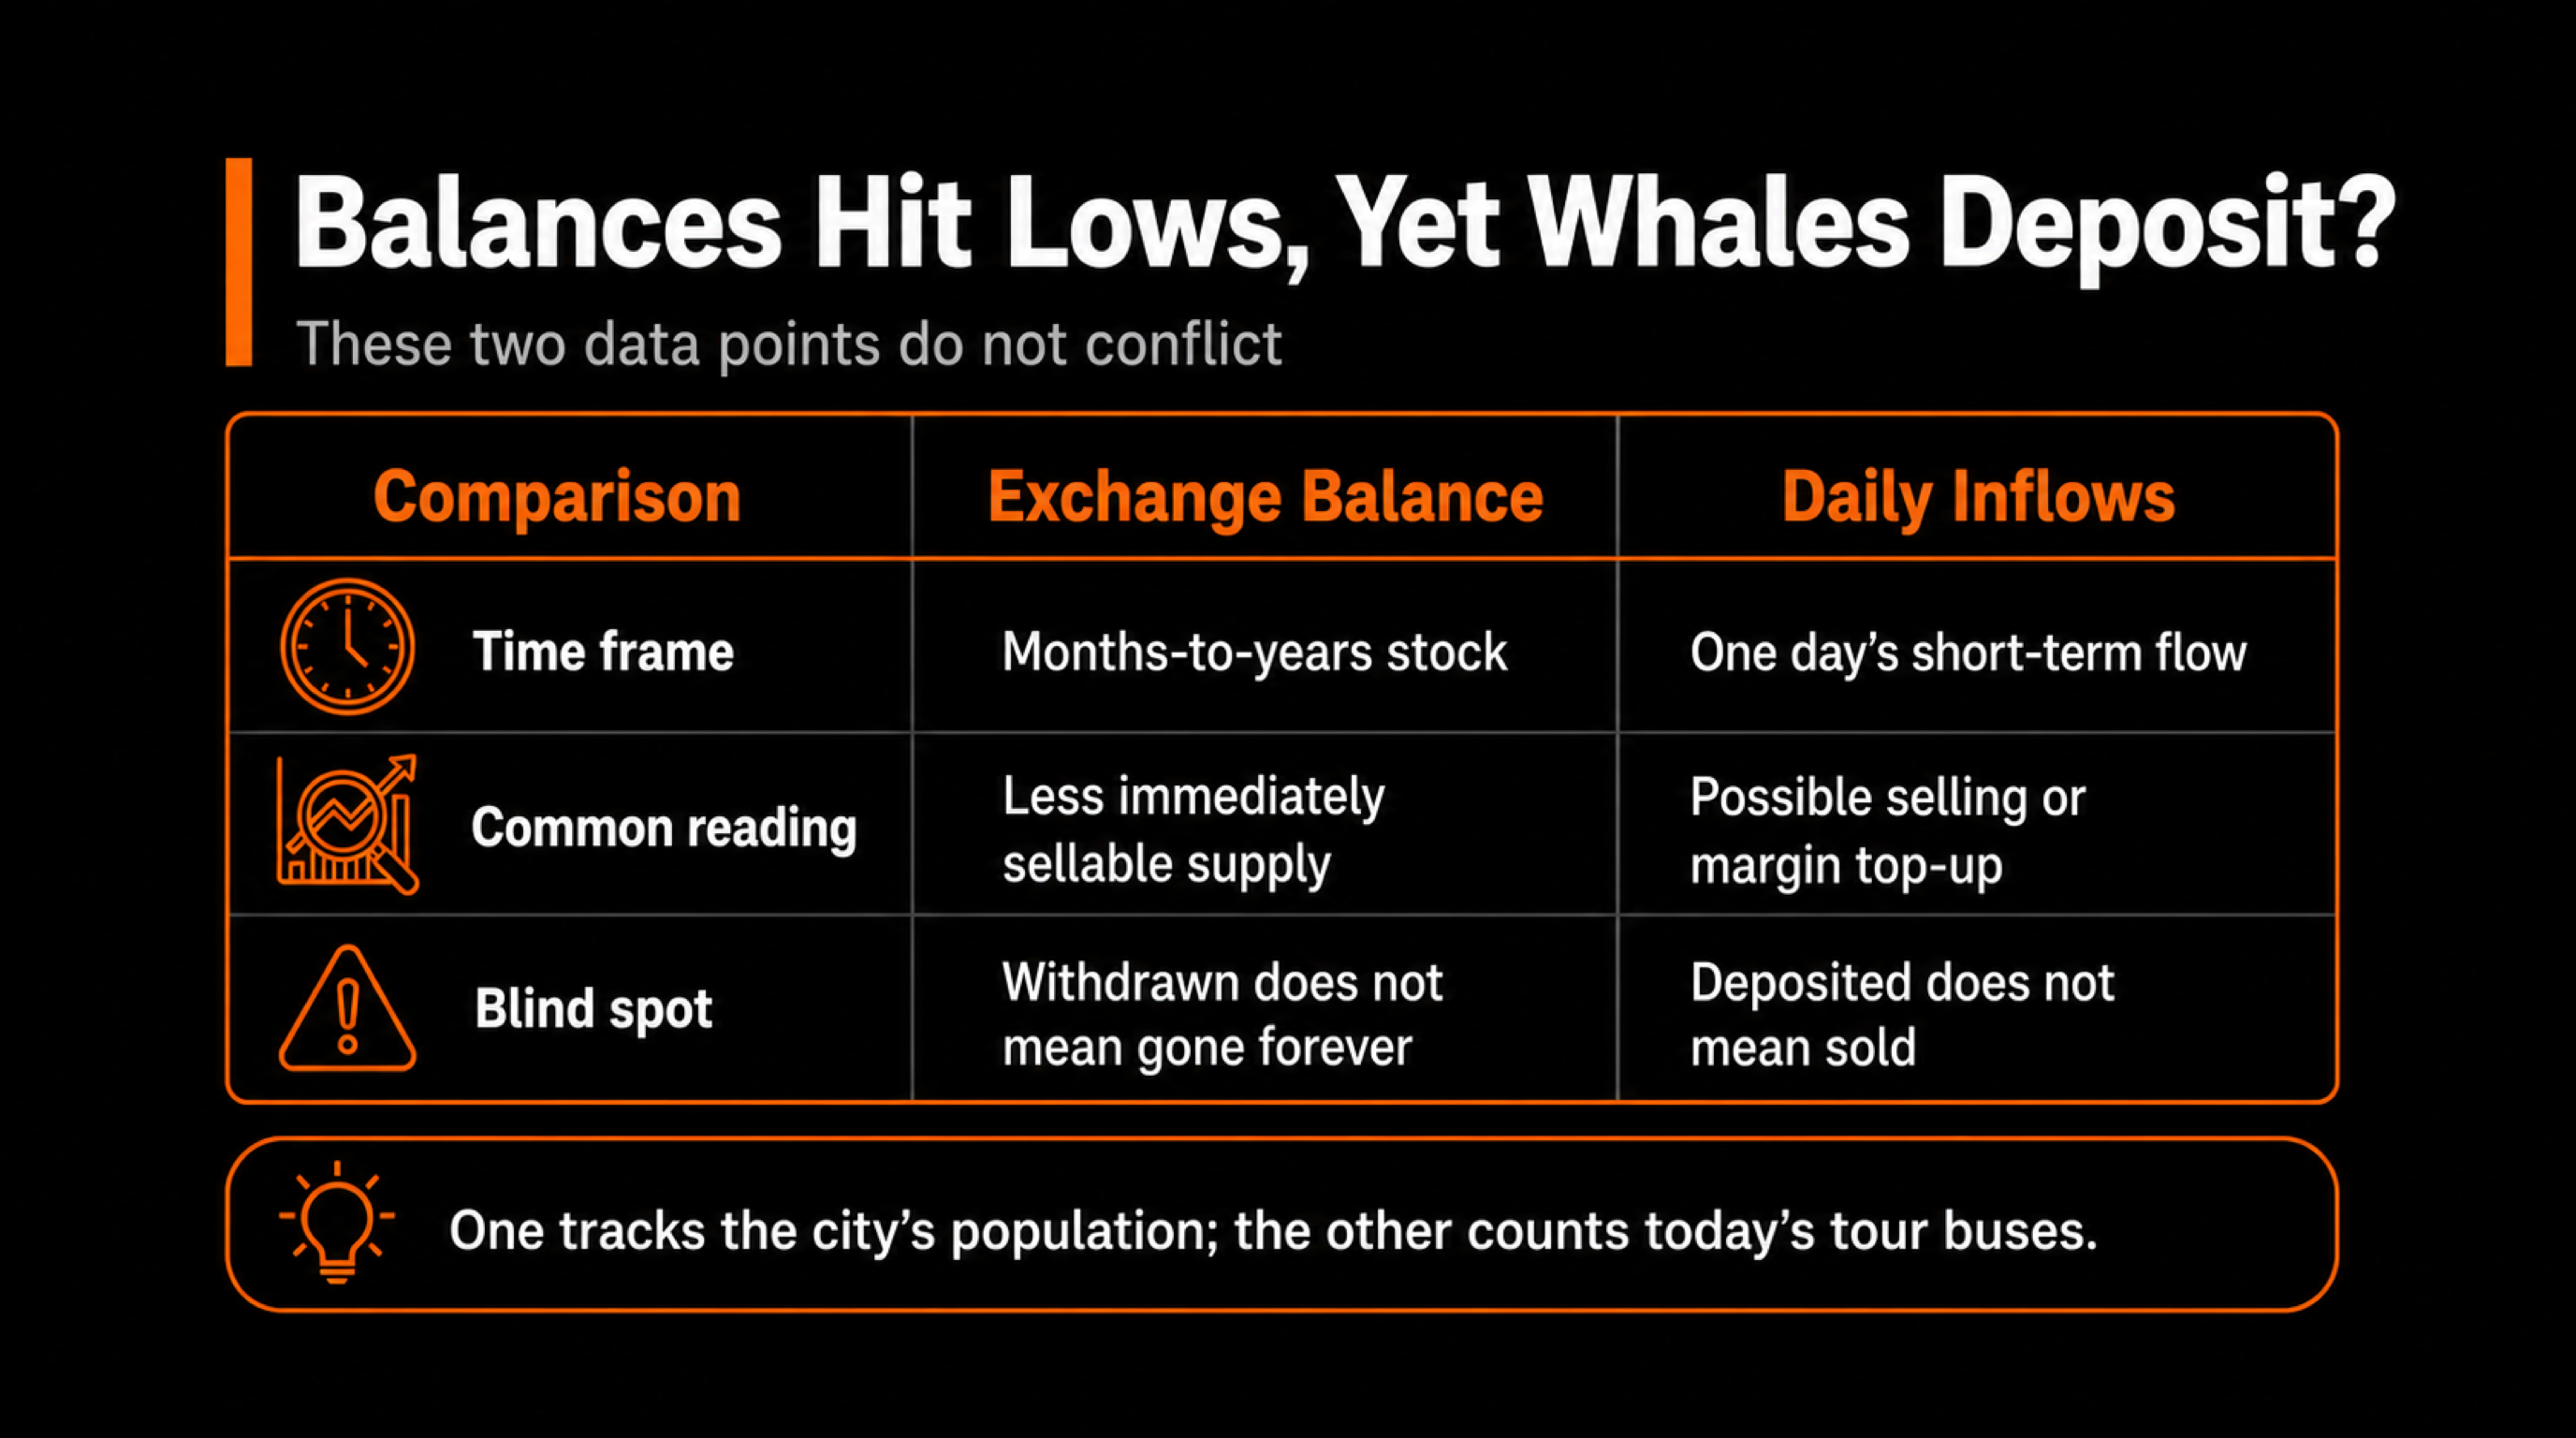
Exchange balance is a stock concept — it reflects the accumulated result of capital continuously migrating toward self-custody, institutional custody, and staking lock-ups over the past several months or even years, so by nature it changes slowly.Single-day inflow, on the other hand, is a flow concept — it looks at short-term capital movement that happens within one specific day, which could just be a one-off move by a single large holder, and that's an entirely different matter from a long-term trend. The two differ in time granularity by several orders of magnitude.
To use an analogy: exchange balance hitting a new low is like tallying up a full year and finding that more people moved out of a city to settle elsewhere than moved in, so the city's population keeps declining. Single-day inflow is like one particular day when a tour bus happens to bring a few dozen people into town to run errands — both things can be entirely true at the same time, and they don't contradict each other at all — the city's long-term population trend isn't overturned just because a few dozen visitors showed up on one particular day, but what those few dozen people are doing in town that day is also worth watching on its own.
Moving Assets Doesn't Mean They've Disappeared: ETFs, Staking, and DeFi Can All Distort the Balance Number
A declining exchange balance is often instinctively read as coins being locked away and never circulating again, but the actual situation is more nuanced.Even though a spot ETF is a buy-and-hold position from an investor's perspective, the issuer still needs to manage redemption and creation liquidity through exchanges or market makers, so the coins involved aren't necessarily frozen forever. Staking works the same way: coins withdrawn to be staked genuinely can't be freely sold during the lock-up period, but once that period ends or the coins unlock, they still have a chance to flow back to exchanges.
DeFi protocols work on a similar principle — plenty of users withdraw coins to put into lending or liquidity provision for yield. On-chain, these coins get classified as having left exchanges, but the capital may still eventually loop back around to address clusters near exchanges. In other words, a declining balance can only prove the coins aren't currently sitting in exchange wallets — it can't prove those coins have permanently exited circulation and will never again constitute sell pressure. There's still a gray area here.
A Whale Transferring Into an Exchange Doesn't Necessarily Mean It'll All Be Sold: Staggered Testing and Standing Orders Also Count as Inflow
By the same logic, a whale transferring coins into an exchange doesn't mean that entire amount will end up executed as a sell order all at once.Many large holders' habit is to transfer in and place orders in batches — putting a portion of their holdings on the exchange first to test market depth and price response. If the sell pressure hasn't been fully absorbed and the price drops more than expected, subsequent batches might be held back, or even repriced higher to wait. The inflow you see on-chain only reflects the coins being moved — it doesn't mean they've all ultimately been sold and exited.
There's also a portion of inflow that's simply the result of switching exchanges, or coins parked temporarily to participate in some activity — nothing to do with sell pressure at all.This is also why analysts advise that single-day inflow should be viewed alongside the balance changes and price action over the following days. If the balance is quickly withdrawn again after the inflow and the price doesn't show clear pressure, then that wave of inflow is likely just capital being reshuffled — not sell pressure actually being realized. The next section on verification steps will lay this out in detail.
When Data Contradicts Itself Like This, How Do You Verify It Step by Step Yourself?
Next time you run into a situation where two data points seem to be talking past each other, won't you also be unsure which side to believe, and end up just picking whichever one you like better?I'd suggest that rather than passively waiting for someone else to interpret it for you, you're better off building your own habit of verification. Below, using three steps, I'll walk you through how to piece the data back into its full picture yourself, without relying on a single media headline.
Step One: Check Multiple Data Sources at Once — Don't Trust a Single Chart or a Single Headline
When you come across contentious on-chain data, the first thing to do is lay all the sources side by side — don't jump to a conclusion just because you saw one screenshot or one headline. For metrics like exchange balance and inflow, different analytics platforms (commonly CryptoQuant, Glassnode, and Santiment) don't necessarily use identical address-tagging lists, so the numbers they calculate for the same point in time can differ slightly. If you only look at a single platform, or a fragment relayed by a single media outlet, it's easy to mistake one platform's particular methodology for the absolute truth of the entire market.
The more practical approach is, when you see data that's sparking discussion, to spend a few minutes searching for whether other platforms have published similar or contradicting observations. If multiple independent sources agree on direction, that signal naturally carries more credibility. If only one platform is talking about it and every other platform's chart looks unremarkable, you should raise your guard — this is very likely just one platform's particular methodology or short-term noise, not yet at the point where it should change your position.
Step Two: Cross-Check Concurrent ETF Fund Flows and Macro Events (Rate-Cut Expectations, Geopolitical Risk)
Exchange balance and inflow never happen in isolation — there's usually a broader capital environment driving them behind the scenes. Whether ETFs are seeing net inflows or net outflows over the same period can help you judge whether long-term capital's stance is leaning optimistic or cautious. If, at the same time, you're also seeing rate-cut expectations heating up or geopolitical risk rising, the market's overall risk appetite will swing along with it, and these external factors are often better at explaining why the price is moving than any single on-chain metric on its own.
For example, if balance hits a new low at the same time ETFs are also absorbing capital, both lines point consistently to inflows, and that reading feels more solid. But if the macro environment turns more cautious at the same time and risk appetite tightens, even a beautifully declining balance number might not be able to withstand the external pressure.Placing on-chain data within the macro backdrop helps you avoid misjudging the whole picture just by looking at one piece of it. This step doesn't take much time, but it's often the dividing line between getting the call right or wrong.
Step Three: Watch Whether Price and Inflow Move Together Over the Following 3-5 Days, Not Just a Single Day's Number
The biggest problem with a single day's number is that the sample is only one day, which makes it easy for a single event to exaggerate or distort it.A more solid approach is to extend the window to 3-5 days, and watch whether the price action in the following days shows corresponding pressure after an elevated inflow reading — if price gradually weakens after inflow spikes, that suggests those coins likely became sell orders. But if price barely reacts, or even stays stable or rises, that's more likely to be the staggered testing or capital reshuffling mentioned earlier, which doesn't really amount to actual selling.
This habit of observing first and judging afterward can help you avoid reacting the instant you see a sensational headline.Most on-chain warnings in the market end up needing to be verified by actual price behavior over the following days. Impulsively entering or exiting based on a single day's number tends to produce a poor win rate over the long run — extending the verification window is a much closer approximation of responsible interpretation.
During This Period of Conflicting Data, What Should You Watch for in Your Position and Risk Management?
Even once you know how to verify the data, when you're facing a phase of tug-of-war like this between bulls and bears, is your position actually prepared for it?Periods when data conflicts like this tend to also be periods when volatility gets amplified most easily. In the three reminders below, the point isn't to teach you which direction to bet on — what I want to remind you is that no matter which way the market eventually goes, don't let your own position get pushed around by emotion first.
Don't Load Up on a Single Bullish Narrative — Lower Liquidity Actually Amplifies Volatility
A narrative like “exchange balance hits a new low” sounds persuasive and easily makes people think supply is scarce and about to moon, tempting them to load up on more position right now to stake a claim.But flip it around: a declining balance and shrinking tradable supply also means market liquidity is contracting. In a thinner-liquidity environment, regardless of whether price goes up or down, the volatility caused by the same amount of capital gets amplified — and for a heavily leveraged position, that means potential drawdown also gets amplified. It's not just the upside that gets bigger.
The more practical approach is to keep the narrative separate from your position size — the narrative can be a reference and can factor into your judgment, but how much you commit should still be decided by your own risk tolerance limit, not by loading up beyond your usual position size just because a story sounds reasonable. This is one of the easiest mistakes people make during a period when the bull and bear data are pulling in different directions.
Set Your Stop-Loss and Scale In/Out in Batches — Don't Let a Whale's Single-Day Spike Scare You Into Buying High and Selling Low
Conversely, if you already have a position on and see news like CryptoQuant's warning of nearly 50,000 BTC flooding into exchanges in a single day, it's very easy to get scared emotionally first, worry the market is about to collapse any moment, and cut your position right at a local low.But then the price doesn't end up dropping anywhere near as dramatically as the headline implied, and you've paid an unnecessary cost in slippage and fees for nothing — looking back afterward, people often realize they overreacted.
The more solid approach is to work out your stop-loss level and your batch pacing for scaling in and out before you even enter, so discipline replaces in-the-moment emotional judgment.When you run into an extreme single-day number, stick to the rules you already set beforehand — don't let a single piece of news throw off your rhythm on the spot. That way, whether the news eventually turns out to be genuine sell pressure or just a false alarm, your position won't end up making a decision that strays from your original plan just because of one day's emotional swing.
Remember That a New Low in Exchange Balance Doesn't Mean Order-Book Depth Is Sufficient — A Large Order Can Still Cause Slippage
One detail that's easy to overlook is that a new low in exchange balance, to some extent, also means the actual supply sitting on the order book is thinning out — and that's a different matter from having sufficient order-book depth. When the tradable supply on the books shrinks, a large order of the same size can chew through a wider price range than it would when the balance is abundant, and for anyone who genuinely needs to enter or exit a large position, slippage costs will be higher than usual. A low balance doesn't mean the market's absorption capacity has gotten stronger.
For the average reader, the practical takeaway from this reminder is that if you plan to move a fairly large position during this period, it's best to place orders in batches rather than executing everything at once with a market order, and to pay extra attention to whether the bid-ask spread has noticeably widened, These are simple ways to gauge whether current liquidity is sufficient, and they're far more practical than just fixating on the phrase “exchange balance hits a new low.”
The Most Common Interpretation Traps Beginners Fall Into When They See This Kind of Data Conflict
By this point, haven't you already noticed that the conflict between these two data points isn't actually as mysterious as it seems?But knowing that is one thing — in practice, I've seen plenty of beginners still easily fall into a handful of recurring interpretation traps. Below, I've laid out the three most common ones, so you can hit the brakes early the next time you run into similar news.
Mistaking a Historical Low for an Imminent Breakout, Ignoring the Time Lag
The first common trap is seeing wording like “exchange balance hits its lowest level since 2017” and instinctively assuming a breakout is coming right away. But exchange balance is a stock indicator built up from a long-term trend — it reflects what has already happened in the past, not a forecast of the future, Historically, after balance hits a new low, price might not react for several months, or it might keep falling further like it did in 2022 — the time lag can stretch out quite long. It's not the case that a corresponding rally shows up the day after a new low appears.
For beginners, a healthier mindset is to treat a new low in exchange balance as a background signal worth keeping an eye on over the long term, not something to use for precisely timing an entry, If you rush to load up on a position the moment you see a new low, without realizing there might still be a wait ahead, you can easily end up bagholding during a consolidation phase — defeating the very purpose you wanted to use this signal for in the first place.
Mistaking a Massive Single-Day Inflow for an Imminent Crash, Ignoring Whether It's Staged Position-Building
The second common trap runs in exactly the opposite direction — seeing CryptoQuant's warning of nearly 50,000 BTC flooding into exchanges in a single day and instinctively reacting with “it's about to crash, get out now.” But as we already broke down earlier, a whale moving coins into an exchange still has several possible explanations — staggered testing, capital reshuffling, switching platforms, and so on, Not every large inflow ends up turning into an actual sell order. Blowing up a single day's extreme number into a sign of an impending crash makes it very easy to make an overreacting decision before you've even confirmed anything.
The more reasonable approach is to treat a massive single-day inflow as a signal to raise your guard, pair it with the verification steps mentioned earlier, and see whether price actually weakens in tandem over the following days before deciding whether to adjust your position, instead of panic-closing your position the instant you see a headline, and turning what might have just been a false alarm into a real loss of your own.
Cherry-Picking Whichever Data Favors Your Own Position — Selective Citation Causing Biased Judgment
The third trap, and also the most hidden one, is selective citation. If you happen to be holding spot right now, your subconscious will be more willing to believe that a new low in balance equals bullish, and automatically dismiss CryptoQuant's warning. Conversely, if you're shorting or sitting in cash watching from the sidelines, you'll instead amplify the whale-inflow warning and selectively ignore the institutional-accumulation evidence the supply-shock camp put forward.This tendency to cherry-pick whichever data favors your existing position direction exists in almost everyone — people just often don't notice it in themselves.
A simple way to avoid this trap is that every time you see data that strongly supports your existing position's direction, deliberately spend time seeking out the opposing argument, and check whether you can actually stand your ground and refute it; If you can't refute it, I'd suggest being more honest with yourself and admitting that, this time, the data genuinely supports two reasonable readings — bullish and bearish alike. Keep your position sized within what you can actually tolerate, and don't rush to use a single data point to justify your existing position.
Conclusion
Exchange balance hitting a new low and nearly 50,000 BTC flooding into exchanges in a single day — these two data points look like they contradict each other, but pulled apart, they're actually results observed on different time scales and at different layers of capital. There's nothing strange about both being true at once.Rather than rushing to pick one side as the truth, you're better off treating both as one piece of a puzzle — combining them with multiple data sources, the macro environment, and the price reaction over the following days to piece together a more complete picture.Position sizing, at the end of the day, is something you alone bear the consequences of. Any piece of data is worth verifying before you decide anything — don't react impulsively just because you saw a headline.


