

Have you watched Bitcoin crash from its $120,000 high to just over $60,000 — and started wondering whether that old script of "the four-year cycle hits and it moons" has stopped working?This piece won't dress up the capital-efficiency cliff as some mysterious signal. Instead, it walks you through how the numbers are calculated, where the gap comes from, and what the two camps in the market are arguing about — so you can decide for yourself whether this drop is a good time to enter or add to your position.
What Exactly Does the Capital-Efficiency Cliff Mean?
You've probably seen the phrase "capital-efficiency cliff" going viral across crypto communities, but what does it actually mean? Simply put, this metric measures how many times the Bitcoin price gets pushed up for every $1 of new capital that flows in, and once you compare that against data from the past four cycles, you'll see that the capital efficiency behind this cycle's gains has dropped to a historic low.
What Is Capital Efficiency (the Ratio of Inflows to Price-Gain Multiples)
In plain terms, capital efficiency is the total amount of new capital that flows in divided by Bitcoin's price-gain multiple over the same cycle. The smaller that ratio gets, the more money the market needs to sustain the same size of rally. This isn't some complicated math model — think of it like a fish tank that keeps getting bigger. Early on, the tank is small, so dropping a single pebble in splashes water everywhere. As the tank gets bigger, dropping that same pebble barely makes a ripple.
Bitcoin's market cap is that ever-growing tank. Back in 2011, the market cap was only a few hundred million dollars, so a bit of new capital could push the price up hundreds of times over. By this cycle, though, the market cap has already reached trillion-dollar territory, so the same amount of new capital naturally moves the price a lot less.That's exactly why analysts look at "capital efficiency" to judge how healthy each cycle is, rather than just looking at the raw percentage gain.
Comparing the Data Across Four Cycles
Lay the four cycles side by side, and the gap between the numbers will make you gasp. Honestly, the first time I put these four sets of figures next to each other, it caught me off guard too — CryptoQuant's capital-efficiency ladder tracks the scale of new capital that flowed in during each cycle, along with the corresponding price-gain multiple Bitcoin produced. Put the four sets of numbers together, and this isn't just "the trend is slowing down" — it's a cliff-edge drop:
- 2011: about $2.8 billion in new capital drove a gain of roughly 55,000%
- 2015: about $69 billion in new capital drove a gain of roughly 10,000%
- 2018: about $365 billion in new capital drove a gain of roughly 2,000%
- This cycle: about $69.7 billion in new capital corresponds to a gain of just 689%
Looking purely at the dollar amount, the capital deployed this cycle actually isn't the highest of the four — but the resulting efficiency is the lowest of all four, and that's exactly where the term "capital-efficiency cliff" comes from. Zoom out across the timeline, and the percentage gain each cycle can produce keeps shrinking — that fact alone is worth more of a place in your decision framework than any single price move.
How the "Over $1 Trillion Needed" Figure Was Calculated
If you extrapolate the slope of "declining capital efficiency" from previous cycles, then for Bitcoin to replicate a similarly sized rally this cycle, CryptoQuant estimates that the new capital injected would need to exceed the $1 trillion mark before efficiency could get back close to previous cycles' levels. This figure isn't some price target pulled out of thin air, it's derived by extending the historical capital-efficiency curve and working backward to see how much capital would be needed to close the gap.
Think of it as a kind of "gap-filling logic": the bigger the market cap gets, the more the required new capital has to scale up proportionally just to keep the same pace of gains — and the amount of capital actually flowing in right now is still a long way short of that $1 trillion threshold.That's also why the market is reading this data as a "capital gap," not simply "the gains are too small."
3 Things Beginners Most Often Get Wrong When They See the Capital-Gap Data
When you see the phrase "capital-efficiency cliff," is your first reaction that Bitcoin is about to crash?Don't jump to conclusions just yet — this data gets taken out of context all the time, and it's easy for beginners to fall into three specific traps. Understand them, and you won't be scared into a rash decision by a half-baked interpretation.
Misconception #1: Falling Capital Efficiency = Bitcoin Is About to Crash
Falling capital efficiency simply means "the same amount of money now moves the price less," not "the price is guaranteed to fall." These are two completely different things. Picture a growing company whose revenue growth rate slows from 50% to 10% — that doesn't mean the company is going bankrupt; it just means growth naturally slows down once you're bigger. Bitcoin's market cap growing from a few billion dollars to trillion-dollar scale, with the gain multiple converging as a result, follows the exact same logic.
What you should pay attention to is that once efficiency falls, the market's sensitivity to new capital changes too — the same inflow now supports a smaller rally, while the same outflow can trigger an amplified drop, and that's the part of falling efficiency that should actually put you on alert — no need to translate it directly into "a crash is coming."
Misconception #2: Cycle Theory Is Dead = Ignore the Halving Timeline
The second common misconception is seeing the structural-theory camp question the cycle pattern and immediately jumping to "the halving timeline is useless now, ignore it." But even as the slope of capital efficiency changes, the supply reduction caused by halving is still a real variable affecting Bitcoin's long-term supply and demand — it just isn't the only factor determining the price's rhythm anymore.
You can treat the halving timeline as one reference point, not the sole basis for your decisions. The market used to rely on a simplified formula like "the top arrives X months after halving" to make decisions, but now that the capital-efficiency structure has changed, betting your entry and exit timing purely on that timeline carries more risk than you might think.
Misconception #3: Institutions Can't Close the Gap = Retail Has Zero Chance
The third misconception is taking "institutional capital may not be able to close the $1 trillion gap" and jumping straight to "retail investors have zero chance." Slower institutional inflows will indeed weaken the market's upward momentum, but that doesn't mean a retail strategy has become meaningless — if anything, it means you need to participate in a more disciplined, phased way, rather than betting it all on a single all-in entry.
Institutions and retail investors are working with different scales of capital and different ways of absorbing risk. Institutions have to think about their overall asset-allocation ratio, while retail investors should focus more on whether they can withstand the volatility — there's no need to follow the institutional narrative and bet on some exact moment when the "gap gets closed."
What Risk Does BTC's Nearly 50% Pullback From Its High Actually Signal?
Bitcoin has slid all the way from its all-time high of $126,000 to just over $60,000, a drop approaching 50%. Is a pullback of this size normal by the standards of past bull-to-bear transitions?This section first breaks down the structural differences — then looks at how leveraged positions get amplified during a drop like this.
How the Pullback From the $126,000 High Differs Structurally From Past Bull-to-Bear Transitions
Bitcoin touched its all-time high of $126,198 on October 6, 2025, before sliding all the way down to its current price of just over $60,000 — a drop of nearly 50%. Looking purely at the percentage, this pullback isn't far off from past bull-to-bear transitions; 2018 and 2022 both saw drops of 50% or deeper, but the structural difference this time is that spot ETFs let large amounts of capital move in and out through institutional channels, so on-chain addresses can no longer fully reflect where the money is actually flowing.
In the past, you could roughly track market money flows through on-chain whale addresses and exchange net inflows/outflows, but ETFs have blurred that layer of information. The price swings you see could be institutional rebalancing triggered by ETF creations and redemptions, or they could be genuine retail panic-selling — the two signals get mixed together, making this pullback harder to read than any before it.
How Leveraged/Futures Positions Get Amplified During a Drop When Capital Efficiency Is Falling
Falling capital efficiency means the market has become more sensitive to new capital, and that sensitivity is especially dangerous during a downturn. When spot buying dries up, leveraged positions in the futures market can end up dominating short-term price swings instead — one wave of selling pressure triggers a chain of liquidations, and the price can plunge far beyond what fundamentals would justify in a very short time. This kind of thing is rarer during periods of high capital efficiency, because spot buying is thick enough back then to absorb most of the selling pressure.
If you're holding a futures position, the most important thing to remind yourself during this period is: the higher your leverage, the more likely you are to get wiped out by a chain of liquidations in this efficiency-cliff market structure — not eliminated by the fundamentals. A lot of the time, the problem isn't that your directional call was wrong, it's that your position size and leverage setting couldn't survive this amplified volatility.
Why "Averaging Down the More It Drops" Can Fail During a Capital-Efficiency Cliff
Averaging down as the price keeps dropping rests on one assumption: that the market will eventually return to its past capital-efficiency level and pull your average cost back up. But if capital efficiency is declining structurally rather than fluctuating short-term, the logic behind averaging down breaks down, because what you're really betting on isn't "the price will bounce back" but "the old efficiency curve will reappear" — and those are two completely different bets.
I personally treat averaging down as a disciplined tool, not an excuse to add to a position mindlessly. At a stage when it's still not settled whether the capital-efficiency cliff is real, averaging down blindly is essentially betting on an assumption that hasn't been verified yet. You need to figure out ahead of time how deep a drawdown you can tolerate, rather than simply believing "a deep drop always means opportunity."
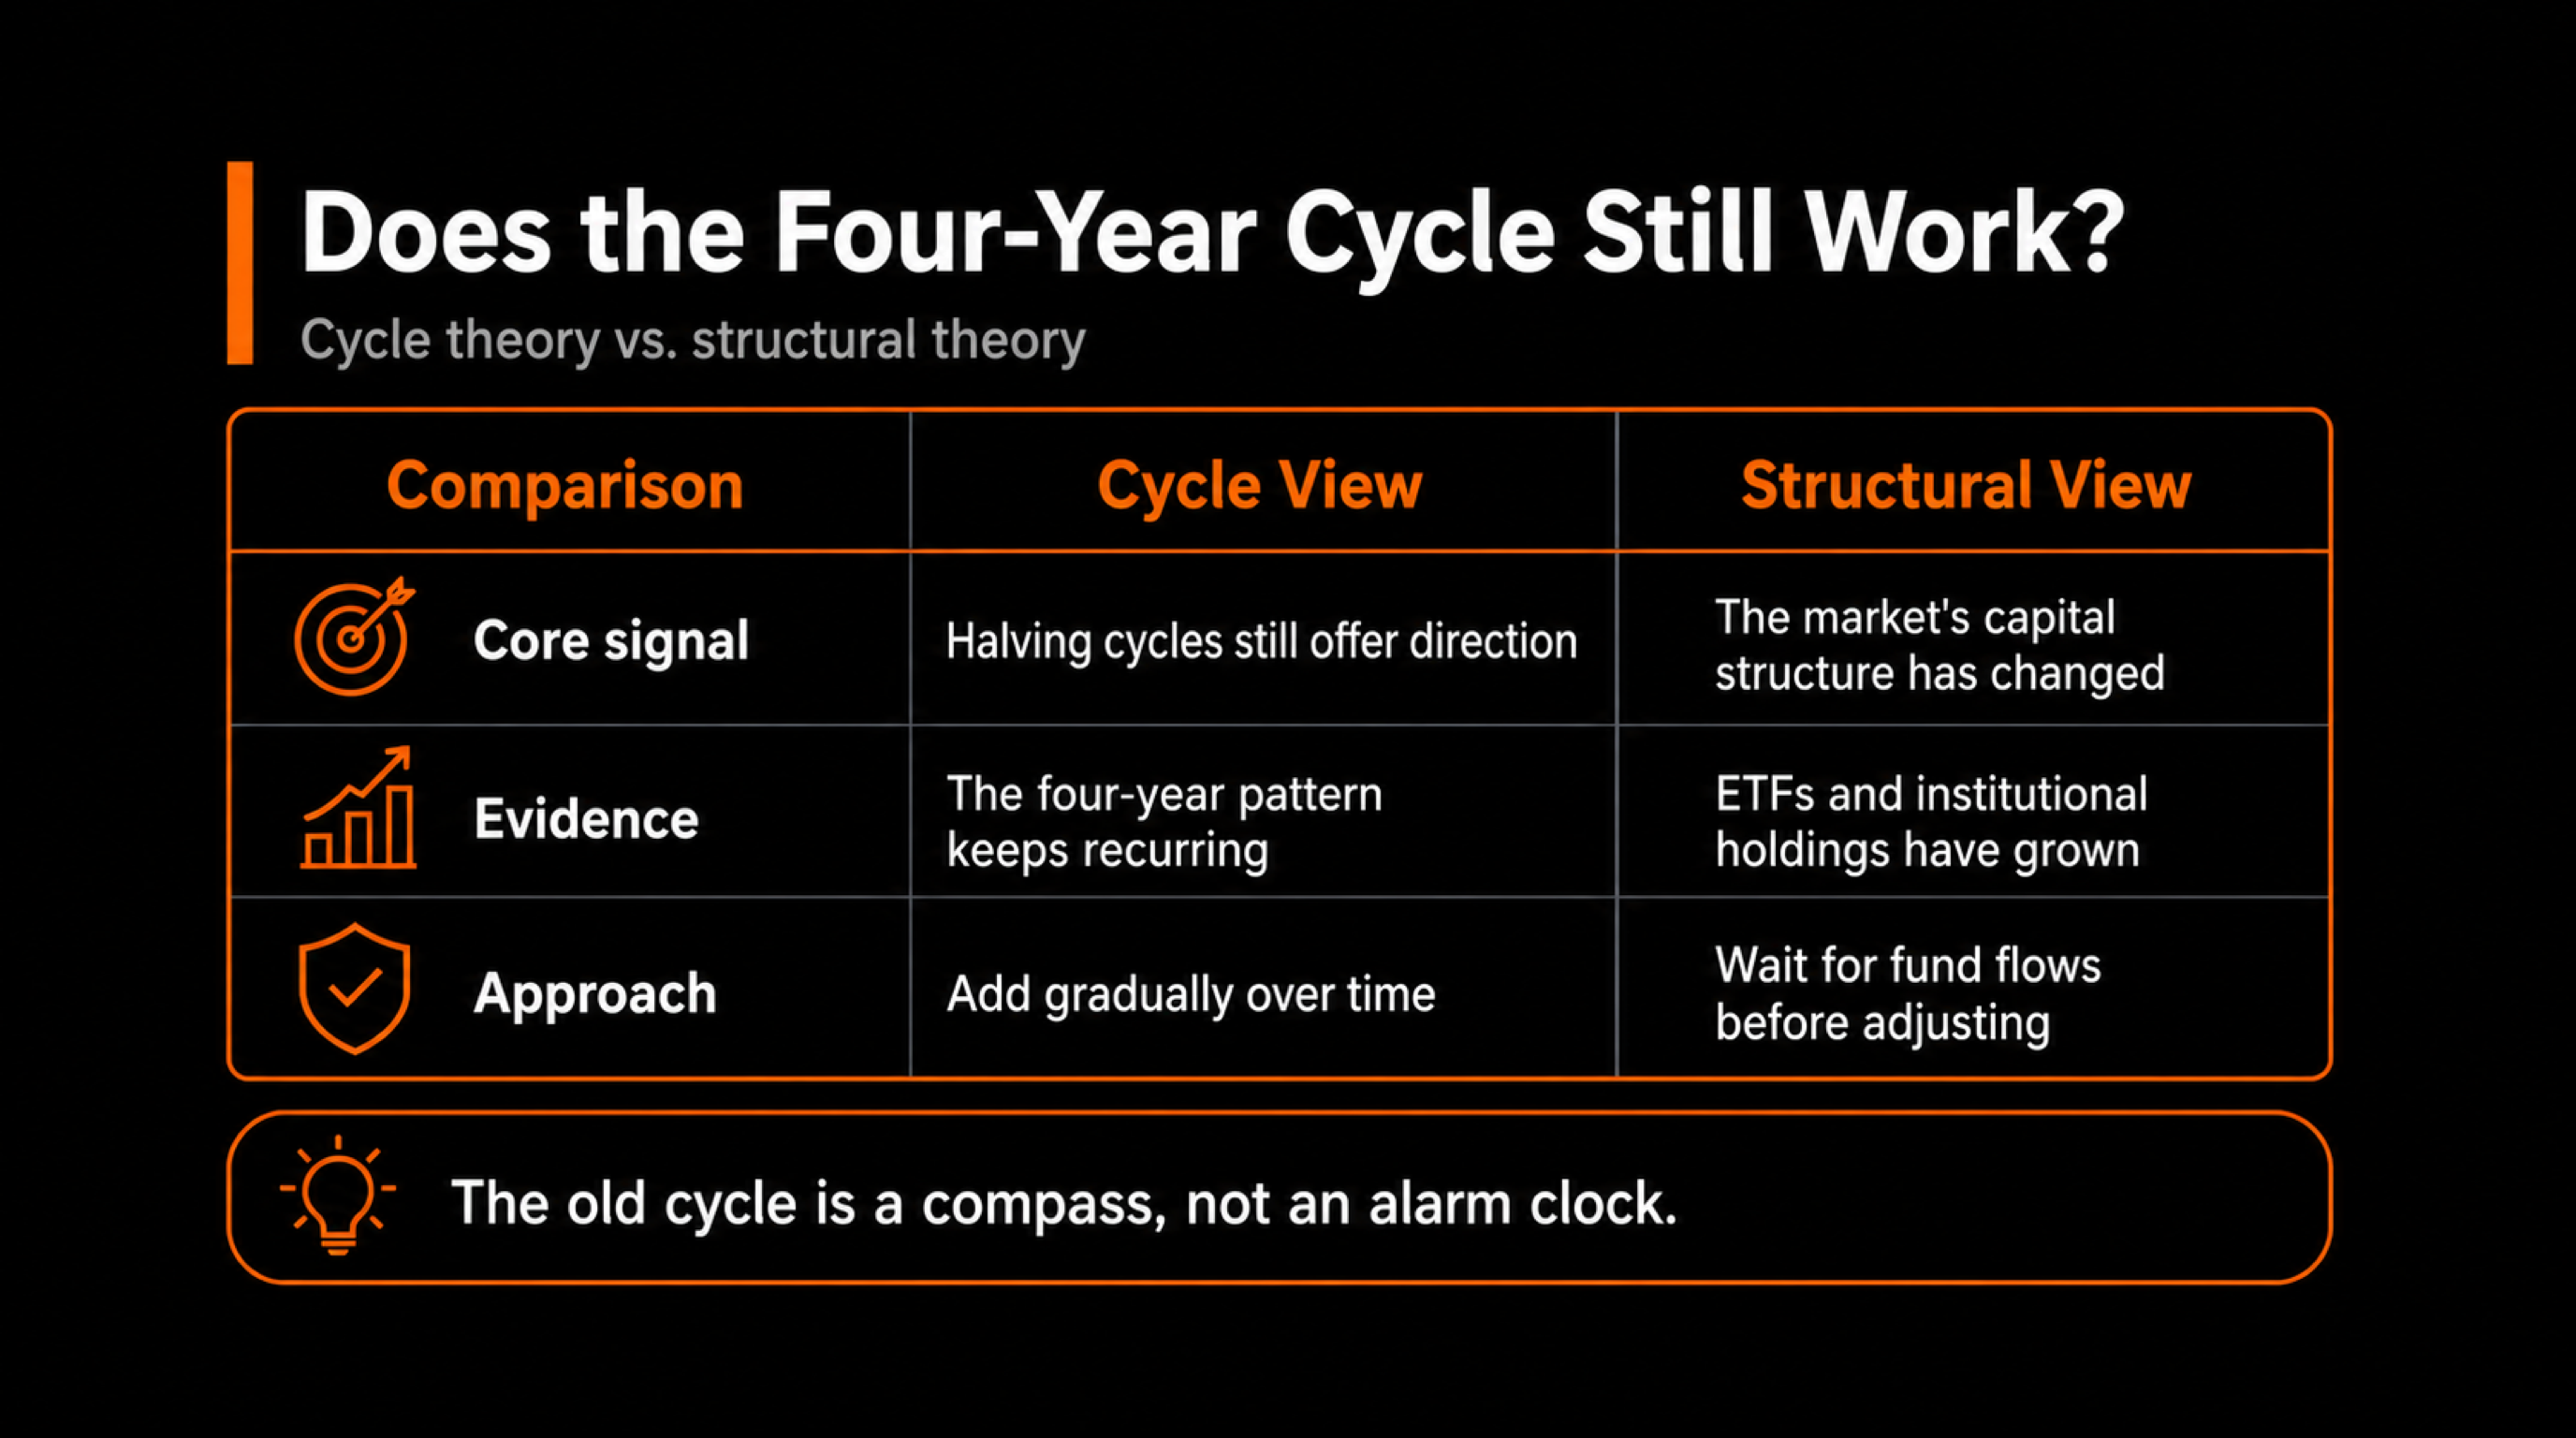
Cycle Theory vs. Structural Theory — What Are the Two Camps Actually Arguing About?
The market is now split into two camps — one insists the four-year cycle hasn't broken down, the other believes the pattern has run its course. Who should you listen to?This section breaks down each side's argument, then looks at the one point where they actually agree.
The Cycle-Theory Camp (Why VanEck's Sigel Argues for Phasing Into a Full Position)
In the cycle-theory camp, VanEck's head of digital assets research, Matthew Sigel, is one of the representative voices. He still argues that Bitcoin's four-year cycle pattern hasn't broken down, and recommends that investors phase into positions with the goal of gradually building up to a full position by October. His logic rests on the fact that, after every past halving cycle, the market has gone on to produce a clear rally within the following one to two years — even if this cycle's capital efficiency is lower, the cycle's directional pattern still holds.
Sigel's argumentisn't telling you to go all-in in one shot — the point is to use a phased pace to deal with uncertainty over time. The assumption behind this approach is that even if capital efficiency worsens, as long as the directional call is right, phasing in can still build up a sufficient position before the cycle turns, but this logic's premise is that the cycle pattern itself still holds up.
The Structural-Theory Camp (Why Ki Young Ju Questions Whether the Cycle Pattern Still Holds)
Standing on the opposite side is CryptoQuant's founder Ki Young Ju, who is the very person behind the capital-efficiency-ladder data. His central argument is that the capital-efficiency structure that used to support the four-year cycle has changed. Possible reasons include a rising share of long-term institutional holdings, which makes supply that would normally surface as selling pressure near the top much stickier, or the overall selling-pressure structure now being completely different from the retail-driven market of the past — the four-year cycle theory itself may simply no longer fit the market's current composition.
Ki Young Ju's positionisn't outright shouting "this time it's going to crash" — the point is to remind the market that if you're still applying the old model of "it moons a few months after halving" to Bitcoin today, you might be missing the fact that the market's structure has genuinely changed. His capital-efficiency data is, in a sense, meant to demonstrate that simply applying the historical timeline is no longer rigorous enough.
The One Thing Both Camps Agree On (Spot ETFs Have Made On-Chain Capital Flows Harder to Track)
Interestingly, whether you're in the cycle-theory or the structural-theory camp, both sides agree on one thing: the arrival of spot ETFs has significantly reduced how trackable on-chain capital flows are. In the past, analysts could piece together a rough picture of market capital flows through on-chain addresses and exchange deposit/withdrawal volumes, but ETFs wrap large amounts of capital into institutional-grade creation and redemption mechanisms, and these actions don't show up directly on-chain. All you get to see is the ETF's overall net inflow/outflow figure — you can't see the actual buying and selling logic behind it.
That means, going forward, no matter which camp you believe, the analytical tools themselves now share a common blind spot. On-chain data that used to be treated as a "leading indicator" now only reflects part of the market. If you still rely entirely on the old on-chain metrics to make decisions, you could miss the real impact that ETF capital flows are having.
Can Institutional Capital Really Close This $1 Trillion Gap?
If the $1 trillion capital gap really exists, can institutional capital close it? This section first looks at the actual current scale of ETF and institutional holdings, then looks at Strategy's own cash-flow situation as a big holder — and what kind of blow that deals to the narrative that "institutions will come to the rescue."
The Current Scale of ETF Capital Flows and Institutional Holdings
Since spot Bitcoin ETFs launched, the cumulative capital they've absorbed is genuinely substantial, and the institutional share of holdings has been rising quarter over quarter. But when you compare that figure against CryptoQuant's estimated $1 trillion gap, current ETF inflows still fall well short of closing it. More importantly, ETF capital flows aren't a steady one-way stream of inflows — there have already been several noticeable waves of net outflows recently, showing that institutional capital also adjusts its positioning based on market sentiment; it isn't an unconditional, permanent source of buying.
If you treat "institutions will keep buying endlessly" as the core assumption of your investment, the current data doesn't support that conclusion. It's a fact that institutional holdings are growing, but whether that growth can keep pace with the widening capital-efficiency cliff is still unclear at this point, and that's also why the "institutions will close the gap" narrative is, for now, closer to a hope than something that has actually happened.
How Tight Cash Flow at Big Holders Like Strategy Undercuts the "Institutions Will Absorb the Selling" Narrative
Known for holding a large amount of Bitcoin, Strategy has recently drawn market attention over tight cash flow — and that's a real blow to the narrative that "institutions will keep absorbing the selling." If even the publicly listed company most aggressively stockpiling BTC is under financial pressure — I'd treat that as a warning sign more worth watching than the price swings themselves — then expecting broader institutional capital to swoop in and close the gap at this exact moment is clearly too optimistic.
This doesn't mean every institution is in the same boat, but it's a reminder that institutional capital doesn't behave exactly the way retail investors imagine — institutions are also constrained by real-world factors like financing costs and balance-sheet pressure.Treating "institutions will eventually come to the rescue" as your sole basis for judgment while ignoring these concrete financial constraints carries real risk.
3 Indicators to Watch That Could Drive Institutional Capital Back In
Rather than guessing whether institutions will close the gap, it's better to keep a close eye on a few concrete indicators. The first is whether the weekly ETF net inflow/outflow trend turns positive again and stays positive for several consecutive weeks. The second is whether institutional holding concentration is changing — whether new large institutions are starting to build positions, not just existing holders adjusting theirs. The third is the financing environment and interest-rate trends, which directly affect institutions' willingness and ability to add to crypto assets.
These three indicators won't give you a clear "enter now" signal, but tracking them consistently lets you spot shifts in the capital structure earlier than if you only watched price movements.Rather than waiting for the narrative to be confirmed before you react, treat this data as your reference point for adjusting your position pace.
How Should Long-Term Holders Adjust Their Pace Right Now?
If you're a long-term holder, how should you adjust your pace in the face of this capital-efficiency cliff and the cycle-theory debate?This section starts by checking whether you're making an emotional decision, then covers the specifics of phased execution, and finally tells you what data to keep tracking going forward.
What to Check to See if Your Decision Is Emotional
Before making any decision to add to or trim a position, ask yourself a few questions first: is this decision based on a concrete change in the data, or simply panic from a sharp price drop? Has your position size already exceeded the maximum drawdown you can tolerate? If the answer leans toward the latter, it means your current decision is more emotionally driven than an information-based judgment.
I've seen plenty of people treat "long-term holding" as an excuse to never review their position, only to end up under more pressure than their risk tolerance could handle once a big pullback hit.Healthy long-term holding means you set your tolerable drawdown range ahead of time — not waiting until the price has dropped 50% before asking yourself whether you can still hold on.
Specific Pacing Suggestions for Phased Execution (Dollar-Cost Averaging In / Phased Trimming)
If you judge that cycle theory still holds some reference value, phasing into a position is a steadier approach than entering all at once. You can split the capital you plan to deploy into 4 to 6 equal portions, investing one portion at a fixed interval (say, every two weeks or every month), and stick to the plan regardless of whether the price is up or down at that moment. This reduces the impact of getting the timing wrong at any single point.
If, on the other hand, you're more worried that structural theory holds and your position is already too heavy, then phased trimming makes more sense than exiting all at once. You can likewise split it into a few equal portions and adjust in stages based on time or price ranges, rather than deciding your entire position on a single big up or down candle.Whether you're adding to or trimming a position, the whole point of pacing your execution is to reduce the impact of any single decision point on your overall position.
What Data Updates to Keep Tracking Going Forward (ETF Flows, CryptoQuant's Capital-Efficiency Metric)
Going forward, the data worth keeping a constant eye on: first, the weekly ETF net inflow/outflow amount, which reflects institutional sentiment in real time; second, CryptoQuant's ongoing updates to its capital-efficiency metric, to see whether efficiency is continuing to deteriorate or showing signs of stabilizing; third, financial updates from big holders like Strategy — any news of forced selling could deal an extra blow to market sentiment. There are currently analysts expecting a short-term bounce, weakness in August and September, and a bottom landing somewhere around Q4, but a timeline like this is exactly one of the narratives this article wants to warn you not to swallow whole.
This data won't change dramatically every day, but building a habit of reviewing it regularly lets you sense a narrative shift early on, instead of only realizing it after the price has already swung wildly.Long-term holding was never about just leaving it alone — it requires continually using data to correct your judgment.
The Most Common Execution Mistakes Investors Make When Following This Kind of Macro Narrative
After going through all this data and the debate between the two camps, you may already have your own take, but what execution pitfalls do investors most often fall into when following this kind of macro narrative? This section lays out the three most common mistakes.
Treating a Single Analyst's Prediction as a Certainty
Whether it's Matthew Sigel's recommendation to phase into a position, or Ki Young Ju's doubts about cycle theory, these are all judgment calls analysts made based on the data available to them — I remind myself this isn't a guaranteed outcome.Treat any single analyst's prediction as a certainty, and you're effectively outsourcing your judgment entirely to someone else. Once that prediction falls apart, you won't know how to adjust, because you never built your own decision framework in the first place.
A steadier approach is to treat different analysts' views as reference points, compare the data yourself, identify the parts of each camp's argument that actually hold up, and form your own judgment from there.This process is more work than simply believing someone's prediction, but it's also the only method that leaves you knowing what to do next if that prediction falls apart.
Using Short-Term Price Swings to Confirm or Disprove a Long-Term Narrative
Both the capital-efficiency cliff and the four-year cycle debate are long-term structural questions spanning months or even years, but a lot of people habitually use a week or two of price movement to confirm or disprove these long-term narratives — the price bounces 10% and suddenly structural theory feels disproven; it drops a bit more and suddenly the cliff theory feels confirmed. Using short-term swings to check against a long-term narrative like this will only make your judgment swing back and forth with the price, losing the consistency it should have had in the first place.
A long-term narrative needs to be validated with long-term data — things like ETF capital flows over several consecutive months, or the quarterly trend in the capital-efficiency metric — not a single week of price action. If you stare at the candles every day trying to question or confirm a judgment that was meant to be long-term, you'll usually end up losing your bearings in the noise and making more unnecessary short-term trades instead.
Ignoring Your Own Position Size and Blindly Copying Institutional-Level Calls
VanEck and similar institutions build their recommendations on their own asset-allocation ratios and risk tolerance, which is completely different from what an ordinary retail investor faces. Institutions can diversify across multiple asset classes, so a single position's swing has limited impact on the overall portfolio. But if you have most of your capital riding on Bitcoin and copy an institution's "phase into a full position" advice directly, the risk you're actually taking on is far higher than what the institution itself carries.
Before following any institutional-level call, you should first confirm whether your own position size and capital allocation can withstand the volatility risk implicit in that strategy.The exact same operating logic can produce completely different outcomes depending on the capital structure and risk tolerance it's applied to — which is also why "copying whatever institutions do" is often one of the most common execution mistakes retail investors make.
Conclusion
Whether the capital-efficiency cliff really means the cycle is dead, or the market's structure is simply transforming, no one can give you a definitive answer at this stage, even CryptoQuant and VanEck, both professional institutions, stand on opposite sides of the debate.What you can do is first understand how the $1 trillion gap was calculated, then judge whether cycle theory or structural theory's argument sits closer to your own risk tolerance, and finally replace a single-point-in-time bet with a phased pace. That will get you through whichever direction the market goes next far better than chasing any one person's prediction.


