

Have you seen the phrase "BTC dominance death cross" and already started planning to shift your position into altcoins?This piece won't dress up the death cross as some magic altcoin-season button. Instead, it walks you through how BTC.D is calculated, what actually happened after the previous two death crosses, how spot ETFs have changed the capital structure this time, and finally whether this line is a reliable basis for your entry right now.
What Is the BTC Dominance Death Cross? What Signal Is This Line Actually Sending?
Have you ever wondered why the same BTC.D chart can show numbers that differ by several percentage points across different platforms?This section first lays out the logic behind the death cross's calculation: how dominance is calculated, why stablecoins distort the number, and why a monthly death cross is on a completely different signal tier from the kind you normally see on a daily chart.
How BTC.D Is Calculated, and Why Stablecoin Market Cap Distorts It
BTC dominance (BTC.D), in its simplest definition, is Bitcoin's market cap divided by the total market cap of the entire crypto market. This ratio looks straightforward, but the problem lies in what's included in the denominator — if the denominator counts the full market cap of stablecoins like USDT and USDC, then every time stablecoin supply changes, BTC.D gets diluted or inflated along with it, and that has nothing to do with Bitcoin's own price movement at all. CoinGecko, CoinMarketCap, and blockchaincenter frequently show BTC.D numbers that don't match each other, sometimes differing by one or two percentage points — and this is why.
At the time of writing, CoinGecko's BTC.D reading was around 56.7%, though some reports noted it briefly touched about 54% intraday, marking a one-month low after pulling back from 58.12%. These two figures might look contradictory, but it's really just a matter of different methodologies and different snapshot times.I'd recommend sticking to one single platform's BTC.D reading over the long run, rather than comparing highs and lows across different sources — otherwise you'll just get more confused, and it's easy to overreact to a single number.
How a Monthly Death Cross Differs in Signal Strength From a Weekly/Daily One
A death cross is defined as a short-term moving average crossing below a long-term one from above — that logic applies on daily, weekly, and monthly charts alike, but the meaning is completely different. A daily death cross shows up once or twice almost every month; there's a lot of noise, and it can get washed out into a golden cross again within a few days, so its reliability as a trading signal isn't high. A weekly death cross has less noise, but it's still easily disrupted by one extreme week — a single long red or green candle is enough to flip the moving-average relationship.
A monthly death cross is a signal on a completely different level. It's calculated using monthly closing prices, so for a monthly-level moving-average cross to occur, it represents a shift in capital preference sustained over months or even years — a day or two of price movement simply can't produce that. Analysts specifically emphasize the rarity of a "monthly" death cross for exactly this reason — it has occurred only a handful of times in Bitcoin's history, and each occurrence has corresponded to a major structural turning point in the market, a completely different tier from the kind of signal short-term traders usually watch.
The Current State of This Death Cross (Recently Formed, Not a Clean Confirmation — With Data Sources Noted)
According to analyst Matthew Hyland, this is the third time in Bitcoin's history that a monthly-level BTC.D death cross has appeared; the previous two were in 2016 and 2021, and this time it's been more than five years since the last one.This signal is described as "rare" precisely because it occurs so infrequently — that has nothing to do with how accurate it's been each time.
One thing worth flagging: this death cross is currently in a just-formed, not-yet-cleanly-confirmed state. It only counts once the monthly close settles, and the moving-average cross relationship could still reverse intraday or mid-month.Combined with the altcoin season index (currently sitting between 47 and 57 across the CMC and blockchaincenter readings), which is far below the 75 altcoin-season threshold, the market is currently still in a transitional phase where "dominance is loosening, but capital hasn't rotated into altcoins on a large scale yet."What this phase really tests isn't your judgment — it's your patience. Treating the death cross as an entry signal too early is a good way to pay tuition before the noise has even cleared.
Why Is "Death Cross = Altcoin Season" a Common Misconception? Where's the Biggest Risk?
As soon as news of the death cross spreads, hasn't someone in the community already started shouting "altcoin season is here"?This section first debunks the two most common misconceptions — mistaking the signal for the outcome, and mistaking a partial move for a full rotation — then discusses the actual price retail investors pay for these misconceptions.
Misconception #1 — Death Cross Appears = Altcoin Season Starts Immediately (Confusing the Signal With the Outcome)
The first misconception is equating "the death cross appears" with "altcoin season begins." A death cross is just a technical indicator telling you that the moving-average relationship has flipped, not that capital has already fully rotated. Historically, there's often a gap of weeks to months between a death cross appearing and altcoin season actually forming, during which BTC.D can go back and forth, even climbing higher again at times. Treating the signal itself as the outcome is like treating an earthquake precursor as if the earthquake has already happened — there's still a long way to go between the two.
What makes this even messier is that this misconception pushes people to rush into action the moment the death cross appears, without waiting for the trend to confirm. I think the more practical mindset is to treat the death cross as a reminder worth starting to watch, not an order to execute immediately. What you should do is treat it as the starting point of your watchlist, verifying it alongside the other indicators covered later — not moving all your capital the moment you see one moving-average cross.
Misconception #2 — Dominance Falling = Capital Flows Into All Altcoins (Ignoring That It Concentrates in a Few Leaders)
The second misconception is more subtle, and it's easier to lose money on: a lot of people assume that when BTC.D falls, capital flows evenly into every altcoin on the market.In reality, the capital usually concentrates into just a handful of large-cap leaders — assets like Ethereum and Solana that already have a clear narrative behind them — while the vast majority of small and mid-cap altcoins get none of it at all, and can even keep grinding lower during the same period.
Every time "rotation" comes up, the list of actual beneficiaries is quite short. If you buy a random basket of altcoins the moment you see BTC.D drop, hoping everyone benefits equally, the usual outcome is that the leaders rally while the coins you're holding stay flat or even lose money.Capital rotation is never evenly distributed — it has an order and selection criteria, and the coins with the best liquidity and clearest narrative are always first in line.
Chasing-the-Top Risk — Common Loss Scenarios From Betting Big on Altcoins Based on a Single Indicator
There's no shortage of historical cases like this: seeing a BTC.D death cross or similar technical signal appear, then putting most of one's capital into a single altcoin all at once, only to end up buying right at a local top, and when dominance then bounces back technically, the altcoin pulls back with it, leaving a significant loss on paper.The common feature in these cases is that the investor looked at only one indicator and treated it as the entire basis for their decision, with no position sizing or any other verification condition attached.
To avoid this, the most basic thing to do is treat any single indicator as one piece of the puzzle, not the whole puzzle. The death cross can be a signal for you to start paying closer attention — it shouldn't be your sole reason for betting big.What you can do at this stage is narrow your watchlist, control your position size, and only consider adding once more signals confirm together — don't blow through all your capital in one shot out of excitement.
What Does History Say? What Actually Happened After the 2016 and 2021 Death Crosses?
If the death cross is really this rare, what kind of script did the market actually play out after the previous two occurrences?This section looks back at what actually happened after the 2016 and 2021 monthly death crosses, and is honest with you about what a sample size of just two does — and doesn't — tell you.
Market Movement and the Time Lag After the July 2016 Death Cross
July 2016 was the first time in Bitcoin's history that a monthly-level BTC.D death cross appeared.The crypto market was far smaller back then, and there were far fewer types of altcoins, but after the death cross appeared, the altcoin frenzy didn't show up immediately. The market went through a period of building momentum first, dominance gradually declined, and capital began spreading into the handful of alternative assets that were getting attention at the time. This time lag stretched over several months, during which BTC.D didn't decline in a straight line either — there were still back-and-forth phases in between.
The lesson from this history is direct — the death cross is a starting point, not an endpoint, and definitely not a guarantee that altcoin season starts the next day. That 2016 capital shift happened against a backdrop where Bitcoin itself kept strengthening too, which is clearly different from the current market environment — we'll come back to this comparison later when discussing ETF capital flows.
The Scale and Retreat Speed of Altcoin Season After the January 2021 Death Cross
The January 2021 death cross corresponds to the wave of altcoin season everyone remembers most vividly: top-ranked altcoins broadly saw multiple-fold gains, new narratives and new sectors took turns in the spotlight, and dominance slid all the way down to a relatively low point.After this death cross, altcoin season did clearly form, and it was the largest in scale of all three death crosses — much of the impression that "death cross equals altcoin season" actually comes from the deep memory left by this one instance.
I think the retreat speed is equally worth noting. This wave of altcoin season didn't take long to go from peak to a clear weakening, and many investors who entered right at the top barely had time to react before watching their paper gains shrink dramatically and even turn into losses.If you only remember 2021's gains and forget how fast the retreat happened, it's easy to assume this death cross will play out the same script — while overlooking just how hard it actually is to time entries and exits.
What a Sample Size of Only 2 Actually Means (The Gap Between Historical Patterns and Statistical Significance)
By this point, you may have already spotted a problem: the two historical cases mentioned earlier amount to a sample size of just two.Two samples, no matter how consistent the outcomes look, don't constitute a statistically meaningful pattern — at best they're precedents worth considering, not a formula you can copy. Treating two observations as a pattern that's bound to repeat is an overreach given how severely limited the data is.
Historical cases aren't without reference value — they just need to be used in the right place: they can help you understand the possible direction and timescale of what follows a death cross, but they can't precisely predict whether or how fast it will repeat this time.This time in particular adds ETFs, a variable that wasn't present in either of the previous two instances, which raises the risk of simply applying historical patterns even further.
How Have ETFs Changed the Capital Structure This Time? Why Is This Time Different?
If neither 2016 nor 2021 had spot ETFs in the picture, how much could adding them this time rewrite the script?This section is the core argument of the whole article: institutional capital now has a new channel for entry, and the cause behind BTC.D's decline this time could be completely different from the previous two instances.
SOL/ETH/XRP Spot ETFs Let Institutional Capital Bypass the Old Path of Buying BTC/ETH First, Then Rotating
In the past, the most common path for institutions to participate in altcoins was to first build a position through a Bitcoin spot ETF, and once capital was in place and risk appetite increased, gradually rotate into assets like Ethereum and Solana through OTC or exchange channels. That required at least one conversion step in between, which was slow and prone to leaking some capital along the way.
Now ETH, SOL, and XRP all have their own spot ETFs, so institutions can buy these assets directly through regulated channels without needing to route through BTC at all.The old path of "BTC absorbs capital first, altcoins rotate in later" has been broken, and the capital structure now has a new branch that didn't exist during the previous two death crosses. This change alone doesn't directly determine whether altcoin season happens, but it does change the path capital flows through, meaning what the BTC.D metric represents behind the scenes is no longer quite the same as it was in 2016 or 2021.
BTC Spot ETF Outflows for Days Straight vs. Altcoin ETF Inflows — Falling Dominance May Be BTC Capital Leaving, Not Rotating Into Altcoins
The numbers in this section are especially prone to being misread through outdated impressions, so I'm reminding myself to clearly mark the timeframe as I write.From mid-May to early June this year, U.S. BTC spot ETFs saw roughly 13 consecutive trading days of net outflows, with the cumulative outflow in that single stretch exceeding $4.3 billion — one of the worst stretches since these products launched. Once July began, the pace of outflows eased somewhat and even saw a single day of inflows, but a fair number of reports from the same period noted that weekly-level net outflows never fully turned positive, and assets like ETH also saw capital outflows during the same window. It wasn't a clean contrast of "BTC flowing out, altcoins steadily absorbing capital."
In other words, there are at least two possibilities behind BTC.D's decline: one is that capital genuinely rotated out of BTC into altcoins; the other is that BTC itself ran into profit-taking or risk aversion and saw outflows that just happened to overlap in timing with other assets' capital flows, without the two necessarily being causally related.These two scenarios lead to completely different follow-on price action — the former is closer to the traditional altcoin-season script, while the latter looks more like a signal that BTC is weakening on its own while the market's overall risk appetite is also contracting. Conflating the two makes it easy to misjudge how to position going forward — I'd say checking the latest ETF capital-flow data right before you act matters more than reading any old article.
What This Means for How You Interpret the Death Cross Signal
Once you factor in ETF capital flows as a variable, this death cross can no longer be interpreted using the old framework from the previous two. In 2016 and 2021, BTC.D's decline was essentially a single path of capital rotating from Bitcoin into altcoins, and the death cross could map relatively directly onto "rotation has begun."This time, BTC.D's decline mixes together both BTC capital outflows and shifts in other assets' capital flows, making the death-cross signal harder to interpret on its own — you need to cross-check it against other data to judge which script this decline is actually closer to.
This is also the point this article wants to emphasize: a death cross does not equal altcoin season, especially this time, when the capital structure is already different from the past.Rather than rushing to conclude by applying historical experience, treat the death cross as a reminder that you should start gathering more evidence — the checklist in the next section is there to help you line up that evidence one item at a time.
How Do You Tell If It's Really Altcoin Season Right Now? A Verification Checklist
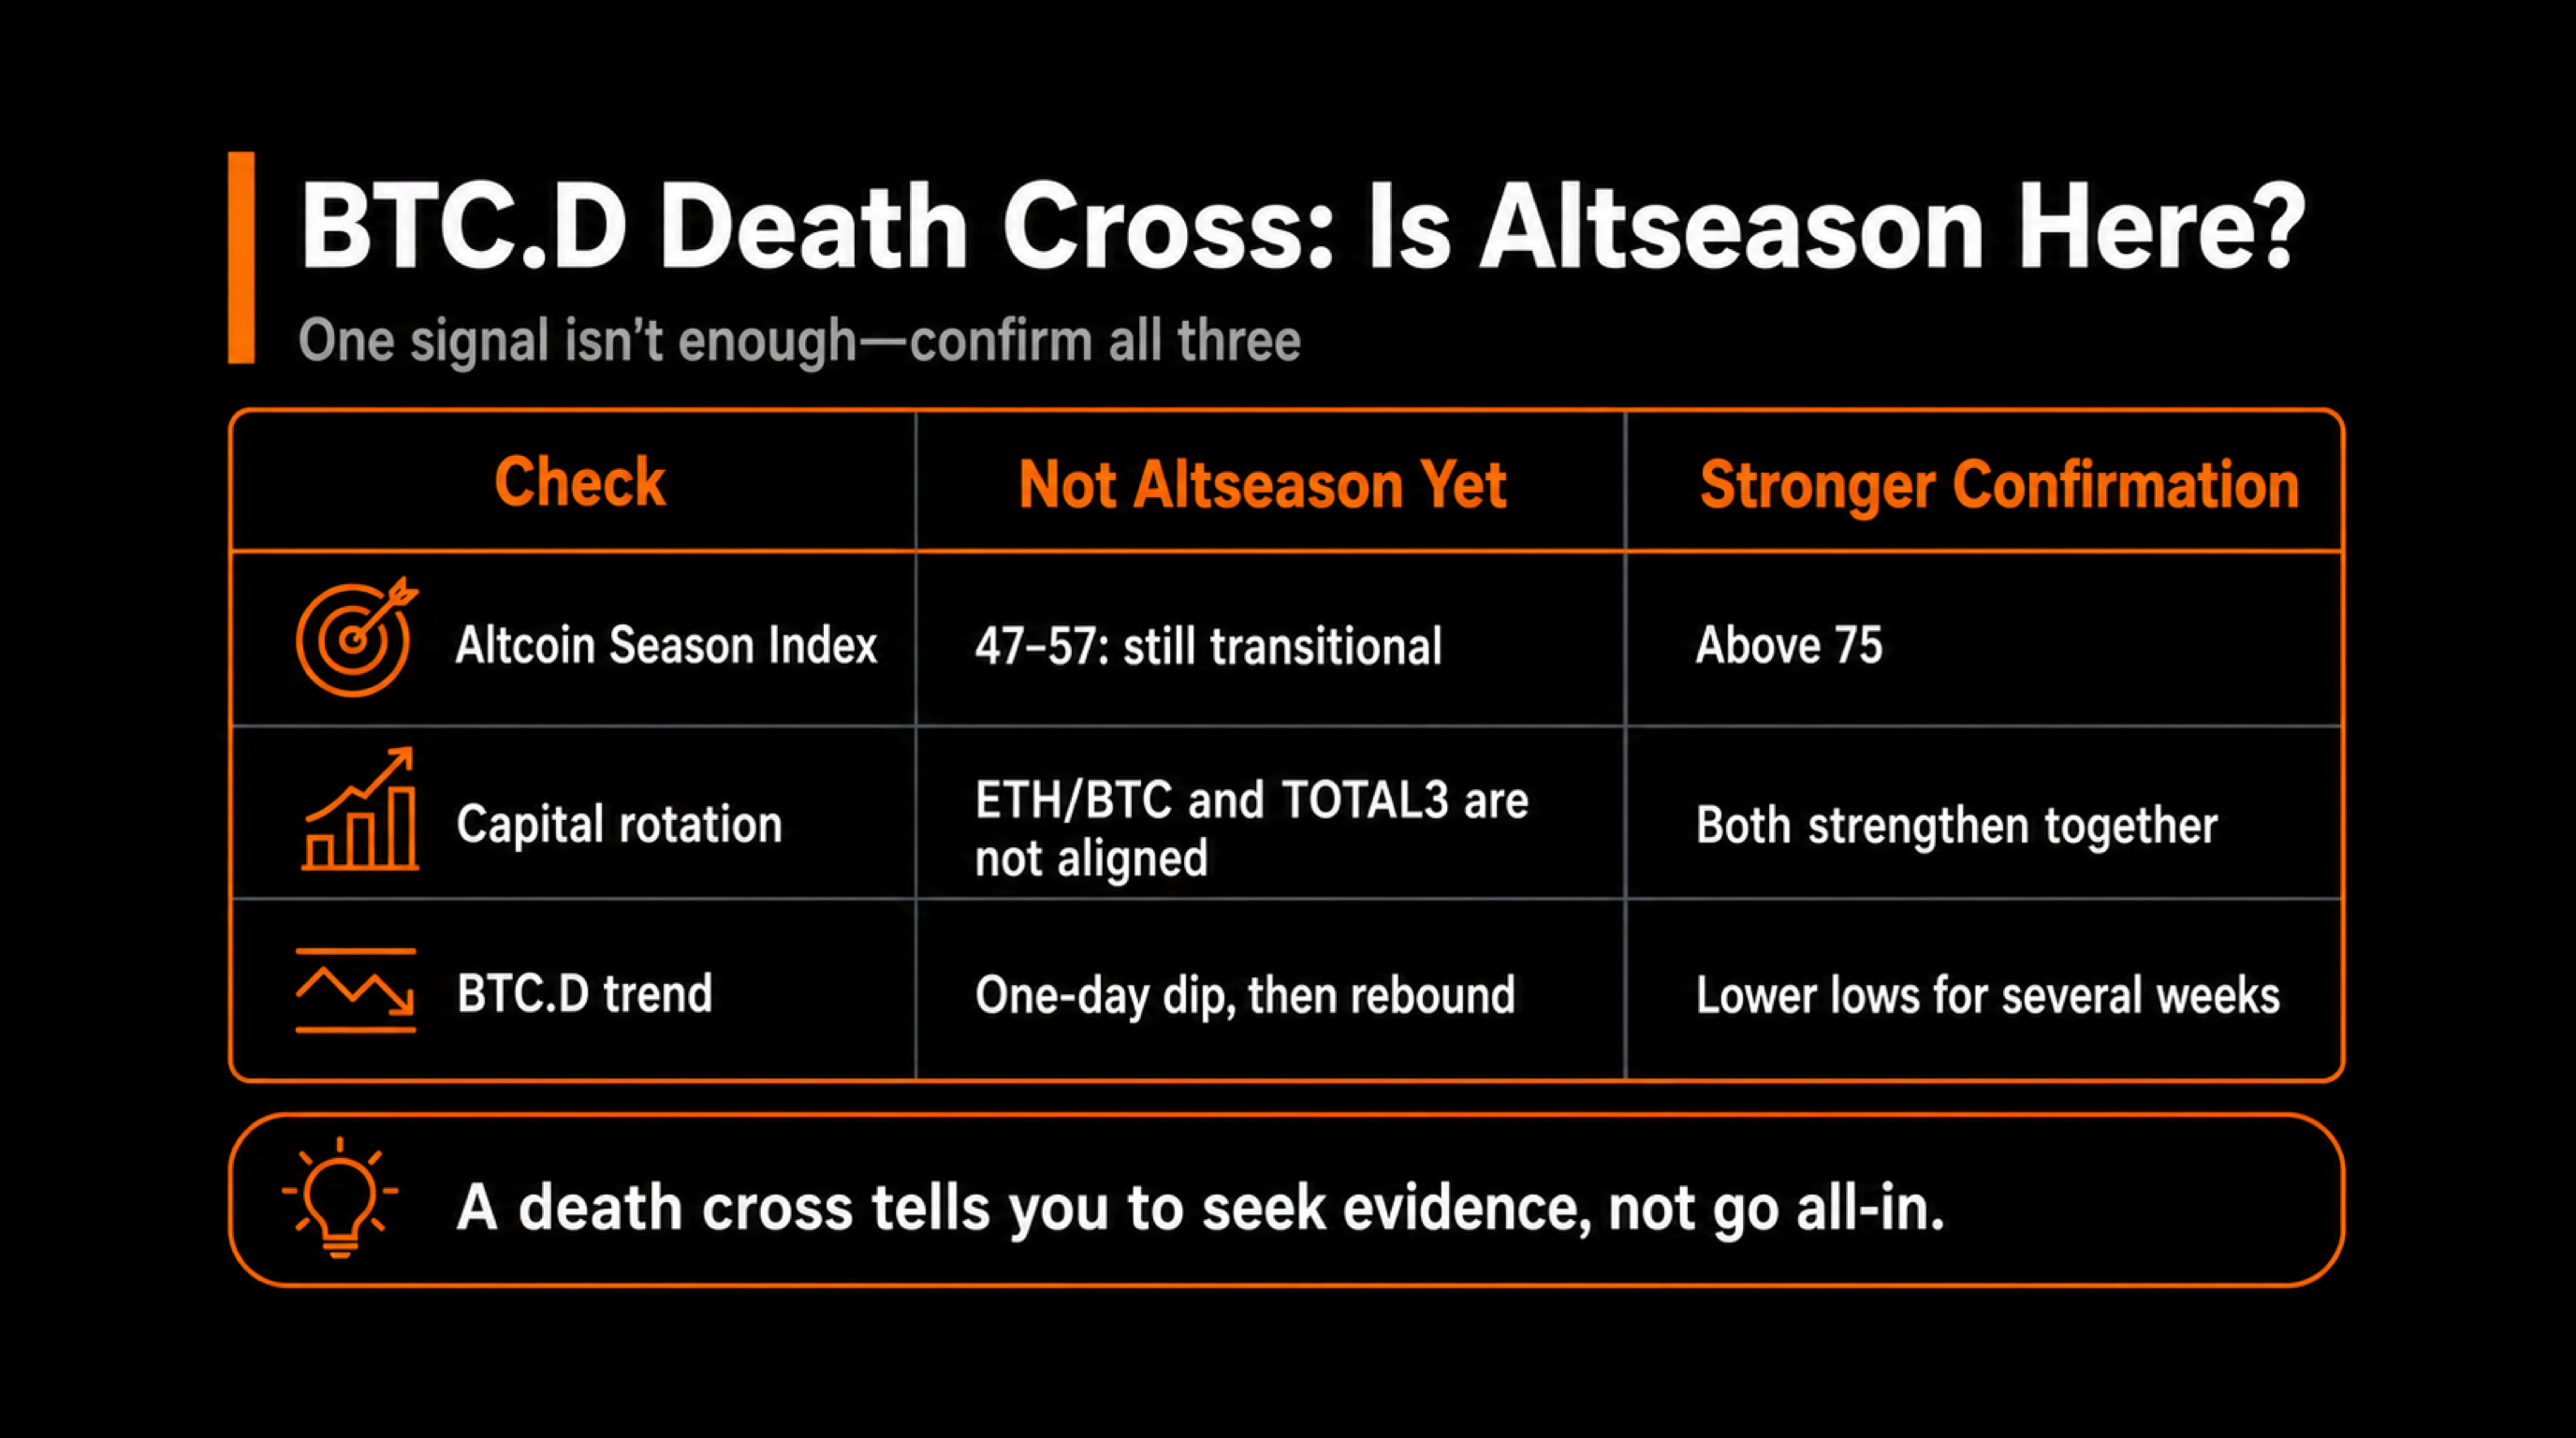
Rather than guessing whether the death cross will turn into altcoin season, wouldn't it be better to have a concrete way to check things yourself instead of listening to whoever's shilling loudest?This section lays out three indicators you can cross-verify, corresponding to the altcoin season index, the coin-to-coin ratio, and the shape of dominance's own price action.
The Altcoin Season Index (Needs to Clear 75) and How to Read the Threshold
The altcoin season index compares a basket of top-market-cap cryptocurrencies against Bitcoin's price performance over a given period, calculating the percentage that outperformed Bitcoin.An index below 25 is typically classified as "Bitcoin season," and only above 75 counts as a clear "altcoin season" — the wide range in between represents capital loosening up, but not yet fully rotating.
At the time of writing, the altcoin season index calculated by both CMC and blockchaincenter sits between 47 and 57 — still a distance from the 75 threshold.Even though the death cross has appeared, the market as a whole is still sitting in a transitional zone of loosening capital, not clear altcoin season. I'd recommend checking this index again every few days — don't treat a single reading as a permanent conclusion, since it actually moves fairly quickly.
Whether the ETH/BTC Ratio and TOTAL3 (Market Cap Excluding BTC/ETH) Are Strengthening Together
Looking at BTC.D alone is easily disrupted by noise like stablecoin supply changes, so it helps to cross-check with two other angles.The first is the ETH/BTC ratio — if this ratio keeps climbing, it means Ethereum is strengthening relative to Bitcoin, one signal that capital is starting to rotate. If the ratio stays flat or even declines, then it's hard to convince yourself this is a rotation even if BTC.D is falling.
The second angle is TOTAL3 — the total market cap of all altcoins once Bitcoin and Ethereum are excluded. If TOTAL3 strengthens in tandem, it means capital isn't just flowing into leaders like Ethereum but spreading more broadly into small and mid-cap assets, which is closer to the textbook picture of altcoin season.Only if both of these angles turn stronger together, combined with BTC.D declining and the death-cross signal, do you have something close to a complete chain of evidence — not a conclusion drawn from a single number.
Whether BTC.D Shows Consecutive Lower Lows, Not Just Single-Day Volatility
The third check is to go back to BTC.D's own price pattern. A single day's decline is easily influenced by short-term volatility or even a single large trade from a whale, so its reference value is limited.A more meaningful signal is a series of lower lows over several consecutive weeks, forming a consistently downward-moving trend, rather than choppy back-and-forth movement in place.
If you notice BTC.D just drops sharply on one day and climbs back within a few days, that's most likely just noise, and there's no need to change your position allocation because of it.Conversely, if the lows really are moving steadily lower, together with the altcoin season index rising, the ETH/BTC ratio strengthening, and TOTAL3 volume picking up together as mentioned earlier — only when all these conditions hold at once are you close to a point worth seriously considering a strategy adjustment.A single condition being met is never enough.
Common Mistakes Before Entering and Risk-Management Principles
Having broken down the signal, the history, and the ETF variable, here's one practical question to ask you at the end: if you really decide to act, how do you plan to manage your risk?This section lays out the two most common execution mistakes, along with three risk-management principles you should think through before entering.
Common Mistake — Going All-In on Altcoins Based on a Single Signal
The most common mistake is seeing a weighty-sounding signal like the death cross and putting most of one's capital into altcoins all at once, without waiting for other indicators to confirm together. This approach looks clever when the indicator turns out to be right, but the moment you get it wrong even once, the resulting loss tends to be at an all-in scale too, with zero cushion.
I've personally seen plenty of similar trades, and they all share the same thing in common: treating the signal's appearance as a 100% win rate, forgetting that any single indicator can be wrong sometimes.A steadier approach is to treat the death cross as one of the conditions that triggers your attention, confirm it alongside signals like the altcoin season index, the ETH/BTC ratio, and TOTAL3, and enter in stages — don't blow through all your capital the moment you see one moving-average cross.
Common Mistake — Ignoring ETF Capital Flows and Misreading Falling Dominance as a Retail-Driven Rally
The second common mistake is ignoring the ETF capital-flow variable entirely, and simply concluding from BTC.D's decline alone that the market has entered a retail-driven altcoin frenzy.As covered earlier, BTC.D's decline this time mixes together both BTC capital outflows and shifts in other assets' capital flows. Failing to distinguish between the two makes it easy to misread this as a simple retail chase, misjudging how long and how strong it will actually be.
The more practical approach is: every time you notice a change in BTC.D, take a moment to check the same-period capital-flow data for BTC spot ETFs and major altcoin ETFs, looking at both sides together instead of basing your decision on a single dominance curve. This habit costs only a few extra minutes but substantially lowers your chance of misjudging the situation.
Risk-Management Principles — Build Positions in Stages, Set Stop-Losses, and Reject the FOMO Mindset
Finally, back to the practical execution level.No matter how you ultimately judge whether this death cross will turn into altcoin season, building a position in stages is the more sensible approach — test with a small portion of capital first, confirm the trend direction, then gradually add. Don't go all in at once. At the same time, every position should have its stop-loss condition set in advance — don't wait until the loss has already grown before deciding on the fly whether to cut it.
One more thing worth specifically flagging: FOMO is the emotion most easily amplified whenever this kind of signal appears — the more heated the community discussion gets, the easier it is to feel like you'll miss the boat if you don't get in now.Having gone through the historical comparison and the ETF capital-structure analysis above, you should already know that there's a long verification process between the death cross and altcoin season — chasing the price in a hurry often just leaves you stuck buying near a local top.Sticking to discipline matters more than nailing the timing.
Conclusion
BTC dominance's monthly death cross really is rare — it's only appeared three times in a decade — but rare doesn't mean accurate, and it certainly doesn't mean altcoin season automatically starts. This time the capital structure is different from both 2016 and 2021: ETFs have given institutional capital a new path, and BTC.D's decline could be mixing together both BTC capital outflows and altcoin capital momentum.What you should actually do is treat the death cross as a starting point that reminds you to begin cross-verifying — the altcoin season index, the ETH/BTC ratio, TOTAL3, and BTC.D's low-point pattern. Only when all these conditions hold together is it worth seriously considering adjusting your position — don't put all your capital on the line the moment you see one moving-average cross.


