In everyday trading markets, if you are able to capture key pivot points, you have the chance to significantly increase your winning rate as the price swings up and down.Signal to Noise Ratio StrategyEverywhere in the leaderboardsSupport and Resistance(Support and Resistance) A set of techniques for performing the operation. For intraday traders, understanding the importance of a signal-to-noise strategy is hard to describe: it can help us determine when price might reverse a bounce or rebound and find a relatively solid foundation for an immediate trend. This article will teach you in depth what a signal-to-noise ratio strategy is, as well as many common types of signal-to-noise trading, such as classic trading, swaps, hedges, continuations, and more, so you can easily master the key techniques of intraday trading.
What is signal-to-noise ratio?
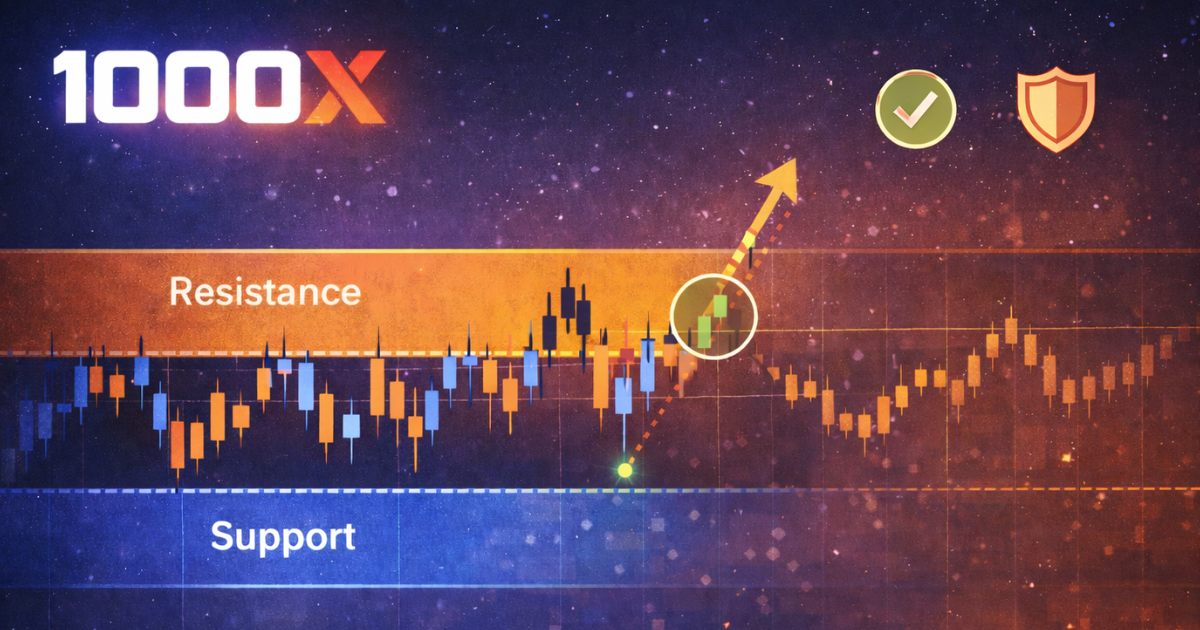
SNRYesSupport and ResistanceAbbreviations, directly translated asSupport and Resistance。 Support refers to a price that may pause and bounce during a fall, such as the “bottom line” in a chart; resistance is a price that may be blocked when the price rises and can be considered an “upper”. On price charts, support and resistance usually appear in the form of horizontal lines or zones: when the price falls several times around it until it falls back, a support zone appears; conversely, when the price approaches a price rise, a resistance zone appears.
The importance of support and resistance
Why are support and resistance so important for traders? Because market prices often appear in these key areaswrithingpossiblyTrend Stop。 For intraday traders, price may attempt to rise and fall every day after market open, including highs and lows from previous trading sessions, large integer prices, or long and short war zones, all of which may be support or resistance on the day. If we can determine these levels and observe the price reaction here, we can predict the next action:Whether the price reverses direction or the strong breakout continues to move forward。
This is very helpful in formulating an entry strategy and managing risk. For example, intraday traders may consider multiple layouts approaching the support level when the price approaches the support level and set a stop loss not far below the support level; on the contrary, when the price approaches the resistance level, it may be a good time to close the headers or enter the flat, and the stop loss may be higher than the resistance level. Whether you've done a lot of things or let go,Benefits of entering near support or resistance positionsIn other words: If a fall is expected and the price breaks through a key point, you can quickly confirm the trade is invalid and set a small stop loss to avoid long-term losses.
It should be noted that the support and resistance levels are not fixed. In market dynamics, often this characteristic after an effective break through the support or resistance areaswitching。 In other words,Declining support levels often turn into subsequent resistance(known asSBR, support becomes resistance),Breaking through resistance may turn into support(known asRoyal Bank of Scotland, resistance becomes support). This phenomenon is very common in intraday trends: for example, when the support price breaks through in the early morning, the price is under pressure during the rebound; or after breaking through yesterday's high, that is, the area where yesterday's high begins to support the price during the pullback. The flexible use of concepts that support resistance reversals enables traders to predict price movements more comprehensively. After understanding the basic concepts of signal-to-noise ratio, we will introduce several common types of signal-to-noise ratio transactions and their meanings and uses on charts.
Tutorial on Common SNR Trading Types
SNR strategies cover many specific chart types and trading methods. Below, we will introduce the different types of SNRs, each with an actual scenario or operating logic to help you understand how they perform on charts and what they are usually used for.
classics
Classic signal-to-noise ratioIt refers to what we call turn A or V, and the position of the signal-to-noise ratio can be confirmed by two K-lines. Instead of looking at the head part, we are not looking at the first solid rod, as the key price we want to consider:
When the price stops falling, we treat this area as a support level, and when the price rises again, we can keep a close eye on signs of a rebound.
This area is a resistance level when the price rises but falls suddenly, and when the price rises again, we can closely watch for signs of a pullback.
interchangeable
toppedSNR type refers to priceBreak through existing support or resistance areas, for example,Long K Line Solid Horizontal LineThis means that the initial multi-space balance has been broken and the price may extend some distance towards the breakout direction.
At this time, the original support line and resistance line may be exchanged after the break (i.e. SBR, RBS mentioned in the preface), we will waitReverse confirmation after breakthroughFor example, you often see that after the price rises, it returns to the original resistance level and then goes on the attack, which proves the effectiveness of the breakthrough.
Head and Shoulder Shapes
Head-to-shoulder signal-to-noise ratioIt is a classic technique of reverse analysis, divided intoShoulder TopversusThe bottom of the head and shouldersTwo types (head and shoulders also called hind shoulders). Its name is because its graphics look like a person's head and shoulders. The head and shoulders usually appear at the end of an uptrend, indicating a possible downward reversal; a headrest at the end of a downtrend indicates an upward reversal. This formation is more important than the shoulder area. Use the position of the left shoulder to see if the right shoulder has formed.
The first peak in price is formed by the front and shoulder examplesLeft shoulder, and then rise again, breaking past the previous high to form a higher risepateIt was high, and then fell again, falling below the left shoulder. At this time, the closing price of the first K column on the left shoulder represents an important resistance level.
successive
Continuous Signal to Noise RatioIt refers to the closing price position of the first K line when two K lines in the same direction appear. This will be potential support or resistance. It is best to have some wires at the intersection of these two K-lines; this continuous signal-to-noise ratio will have more reference values.
In fact, the continuous signal-to-noise ratio is just another signal-to-noise ratio that occurs in the low time range (LTF) and the high time range (HTF). During price changes, there must be some reversal (part of the front line). The inverse part will be the signal-to-noise ratio, so the continuous signal-to-noise ratio is indicative.
How to enter and exit SNR?
In our practice, we do not place a direct position order in the SNR region, but wait patiently for the price to test the validity of the region. For example, the price may break through the position of the signal-to-noise ratio, but then close again on the K line, which has a clear lead. This lead indicates that the market briefly challenged the region, but ultimately failed to break through, indicating that the two sides have reached a certain degree of balance here. Only when we see this price movement do we begin to seriously consider the possibility of entry.
The signal-to-noise ratio through such a wire is called the unrefreshed signal-to-noise ratio, and the signal-to-noise ratio that is not affected by the price is called the new signal-to-noise ratio.
In addition, we do not rely on a single timeframe to make judgments, but rather combine the analysis of multiple timeframes to create a more complete trading plan.
Observations are usually made over a higher time range, such as a daily chart or 4-hour chart, to see if a signal-to-noise ratio range is reached to form a front-end close. If you see such a signal over a longer period of time, it means that the market may reverse. At this time, we expect the price to fall back and test the untested signal-to-noise ratio in the other direction over the same timeframe.
For example, the figure below is the daily line for Bitcoin. We observed that the price fell after the recent daily support level (Green Line DS). At this point, we can continue to observe whether price reversals are intentional and may touch recently untested daily resistance, which can be used as TP. In this example, we have 3 options: DR1 (continuous), DR2 (head and shoulder type) and DR3 (classic).
Then we switch to a lower time range, such as 1hr K, to look for confirmation of price breakouts as input.
As shown in the figure below, it is basically possible to enter the BOS or CHOCH directly after completion in a short period of time. The stop position can be set to the nearest low point. If you want to see a relatively distant target point, it is recommended to slightly extend the stop loss point while maintaining a good profit and loss ratio.
Relationship between SNR and SMC policy
After understanding the various signal-to-noise trading strategies mentioned above, you may also have heard of the strategies that have been popular in recent yearsSMC Strategy(Smart currency concept, smart currency trading concept). In fact, SNR and SMC basically have a lot in common:At the heart of the key areas and changes in the market structure about pricesDetermine what happened. Support and resistance levels are visible pivot points on the price chart, and the SMC further explains the reasons for these points by highlighting how key participants in the market (e.g. institutions, major institutions) can take advantage of these price increases.
You will find that SMC can explain many concepts of SNR. For example, “price crosses signal-to-noise ratio and boundary lines” actually occurs in SMCMobile HuntingThe so-called signal-to-noise ratio area is actually a place with great fluidity.
Also, did you find that the interchangeable SNR is actually very similar to the SMCDestroy BlocksConcepts.
Therefore, many mature intraday traders willCombining two angles of SNR and SMCLet's analyze it. My own suggestion is that during peak periods, you should pay attention to testing the nearest signal-to-noise ratio to determine the general direction of development; low timeframes make more use of SMC to infer intelligent monetary intentions, find more accurate target points (such as highs or lows, time highs and lows), and wait for dynamic flow to progress Do it before the trip.
All in all, SNR is a foundation that trading beginners must master proficiently, while SMC is an advanced mindset based on signal-to-noise ratio. THE TWO ARE NOT THE OPPOSITE; THEY COMPLEMENT EACH OTHER: LEARN THE BASICS OF DRAWING SUPPORT RESISTANCE LINES AND IDENTIFYING DIFFERENT TYPES THAT CAN BE USED AS TECHNICAL ANALYSIS; PLUS, YOU CAN LEARN HOW SMC WORKS TO UNDERSTAND HOW THE SMART CURRENCY BEHIND THE MARKET WORKS, SO YOU CAN GAIN A DEEPER UNDERSTANDING OF MARKET TRENDS. If you are interested in SMC strategies, you may need to gradually expand your learning range after mastering the signal-to-noise ratio strategy, which will help improve your trading skills and goal awareness.
epilogue
SNR trading strategies are a set of practical techniques about support and resistance. For intraday traders, the flexible use of the signal-to-noise ratio concept helps us find our footing in a fast-changing market without blindly chasing or panicking.
Also, remember that no strategy fails: when support fails, resistance is also broken. The key is to adjust your strategy accordingly and manage risk properly. Readers are advised to practice various types of articles in practice to deepen their impression of the theory. After mastering the essence of the signal-to-noise ratio strategy, you can rest assured that you will be more flexible in the day trading process and move towards the goal of stable profits!